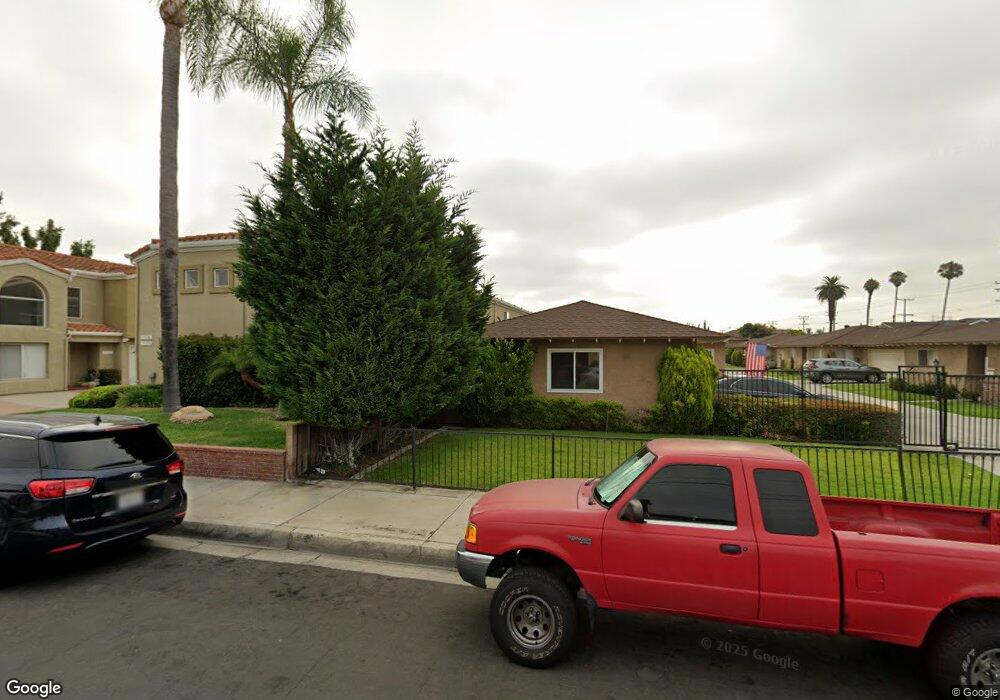
17630 1/4 Virginia Ave Unit 14 Bellflower, CA 90706
Estimated Value: $643,000 - $685,000
3
Beds
3
Baths
1,618
Sq Ft
$410/Sq Ft
Est. Value
About This Home
This home is located at 17630 1/4 Virginia Ave Unit 14, Bellflower, CA 90706 and is currently estimated at $663,008, approximately $409 per square foot. 17630 1/4 Virginia Ave Unit 14 is a home located in Los Angeles County with nearby schools including Craig Williams Elementary School, Mayfair High School, and St. Bernard School.
Ownership History
Date
Name
Owned For
Owner Type
Purchase Details
Closed on
Jan 4, 2017
Sold by
Qin Joshua
Bought by
Qin Joshua and Qin Shu Xin
Current Estimated Value
Home Financials for this Owner
Home Financials are based on the most recent Mortgage that was taken out on this home.
Original Mortgage
$300,000
Outstanding Balance
$246,338
Interest Rate
4.08%
Mortgage Type
New Conventional
Estimated Equity
$416,670
Purchase Details
Closed on
Apr 30, 2001
Sold by
Torres Ramiro S and Torres Georgina
Bought by
Qin Xiao Jun
Home Financials for this Owner
Home Financials are based on the most recent Mortgage that was taken out on this home.
Original Mortgage
$149,600
Interest Rate
7.15%
Purchase Details
Closed on
Apr 26, 2001
Sold by
Torres Ramiro S and Torres Georgina
Bought by
Torres Ramiro S
Home Financials for this Owner
Home Financials are based on the most recent Mortgage that was taken out on this home.
Original Mortgage
$149,600
Interest Rate
7.15%
Create a Home Valuation Report for This Property
The Home Valuation Report is an in-depth analysis detailing your home's value as well as a comparison with similar homes in the area
Home Values in the Area
Average Home Value in this Area
Purchase History
| Date | Buyer | Sale Price | Title Company |
|---|---|---|---|
| Qin Joshua | -- | Nextitle | |
| Qin Xiao Jun | $187,000 | American Title | |
| Torres Ramiro S | -- | American Title |
Source: Public Records
Mortgage History
| Date | Status | Borrower | Loan Amount |
|---|---|---|---|
| Open | Qin Joshua | $300,000 | |
| Closed | Qin Xiao Jun | $149,600 |
Source: Public Records
Tax History Compared to Growth
Tax History
| Year | Tax Paid | Tax Assessment Tax Assessment Total Assessment is a certain percentage of the fair market value that is determined by local assessors to be the total taxable value of land and additions on the property. | Land | Improvement |
|---|---|---|---|---|
| 2025 | $3,785 | $281,751 | $105,465 | $176,286 |
| 2024 | $3,596 | $276,228 | $103,398 | $172,830 |
| 2023 | $3,457 | $270,813 | $101,371 | $169,442 |
| 2022 | $3,394 | $265,504 | $99,384 | $166,120 |
| 2021 | $3,320 | $260,299 | $97,436 | $162,863 |
| 2019 | $3,234 | $252,581 | $94,547 | $158,034 |
| 2018 | $3,123 | $247,630 | $92,694 | $154,936 |
| 2016 | $2,987 | $238,017 | $89,096 | $148,921 |
| 2015 | $2,926 | $234,443 | $87,758 | $146,685 |
| 2014 | $2,890 | $229,851 | $86,039 | $143,812 |
Source: Public Records
Map
Nearby Homes
- 9112 Cedar St
- 17639 Virginia Ave
- 9133 Ramona St Unit 2
- 17441 Virginia Ave Unit E
- 9253 Rose St
- 17820 Lakewood Blvd Unit 31
- 17820 Lakewood Blvd Unit 30
- 17820 Lakewood Blvd Unit 3
- 17604 Lakewood Blvd Unit 24
- 6138 Pepperwood Ave
- 9312 Palm St Unit 209
- 6107 Faculty Ave
- 6157 Pimenta Ave
- 9513 Cedar St
- 6103 Sunfield Ave
- 6034 Pepperwood Ave
- 8723 Artesia Blvd Unit 68
- 8723 Artesia Blvd Unit 89
- 5968 Blackthorne Ave
- 9224 Walnut St
- 17630 1/2 Virginia Ave
- 17632 3/4 Virginia Ave
- 17634 1/2 Virginia Ave Unit 7
- 17636 3/4 Virginia Ave
- 17638 1/2 Virginia Ave Unit 2
- 17632 Virginia Ave Unit 1/2
- 17630 Virginia Ave Unit 3/4
- 17630 Virginia Ave
- 17630 3/4 Virginia Ave Unit 12
- 17632 Virginia Ave
- 17632 1/2 Virginia Ave
- 17634 Virginia Ave
- 17636 Virginia Ave
- 17636 1/2 Virginia Ave
- 17638 Virginia Ave
- 17638 3/4 Virginia Ave
- 17646 1/2 Virginia Ave
- 17642 Virginia Ave
- 17648 Virginia Ave Unit 4
- 17640 1/2 Virginia Ave Unit 3