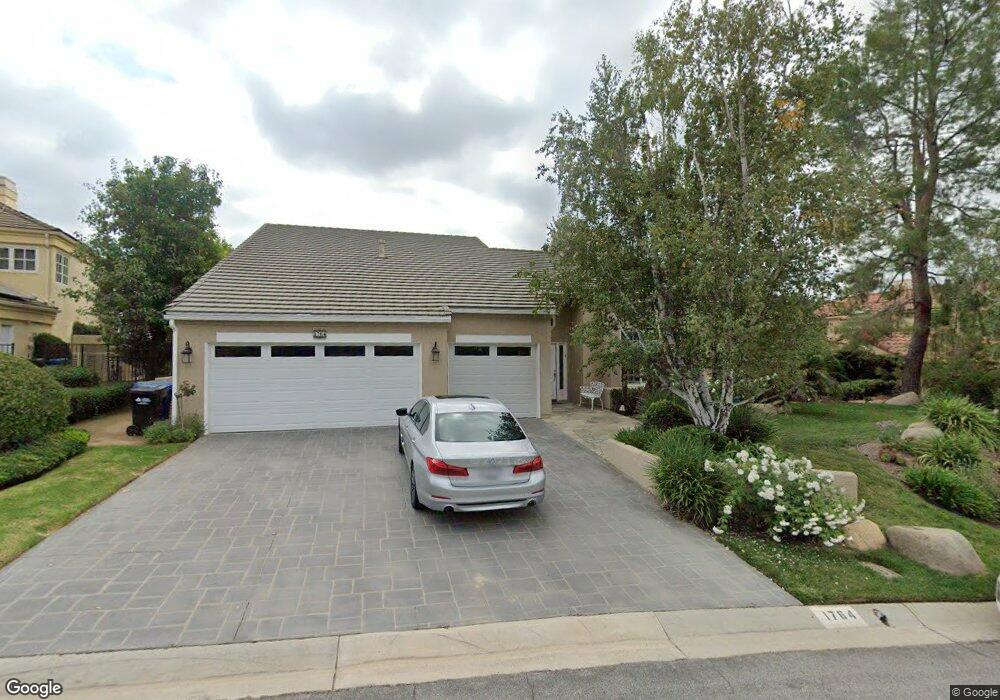
1764 Misty Creek Rd Westlake Village, CA 91362
Estimated Value: $1,998,145 - $2,712,000
3
Beds
3
Baths
2,796
Sq Ft
$817/Sq Ft
Est. Value
About This Home
This home is located at 1764 Misty Creek Rd, Westlake Village, CA 91362 and is currently estimated at $2,285,286, approximately $817 per square foot. 1764 Misty Creek Rd is a home located in Ventura County with nearby schools including Westlake Hills Elementary School, Colina Middle School, and Westlake High School.
Ownership History
Date
Name
Owned For
Owner Type
Purchase Details
Closed on
Mar 29, 2023
Sold by
Doctrow Schlegel Survivors Trust
Bought by
Steven Doctrow Trust
Current Estimated Value
Purchase Details
Closed on
Aug 26, 2013
Sold by
Doctrow Steven B and Schlegel Sandee I
Bought by
Doctrow Steven and Schlegel Sandee
Purchase Details
Closed on
Sep 22, 1994
Sold by
Millhouse Robert F and Millhouse Beverly J
Bought by
Doctrow Steven B and Schlegel Sandee I
Home Financials for this Owner
Home Financials are based on the most recent Mortgage that was taken out on this home.
Original Mortgage
$468,800
Interest Rate
5.3%
Purchase Details
Closed on
Apr 21, 1994
Sold by
Millhouse Robert F and Millhouse Beverly J
Bought by
Millhouse Robert F and Millhouse Beverly J
Create a Home Valuation Report for This Property
The Home Valuation Report is an in-depth analysis detailing your home's value as well as a comparison with similar homes in the area
Home Values in the Area
Average Home Value in this Area
Purchase History
| Date | Buyer | Sale Price | Title Company |
|---|---|---|---|
| Steven Doctrow Trust | -- | None Listed On Document | |
| Doctrow-Schlegel Survivors Trust | -- | None Listed On Document | |
| Doctrow Steven | -- | None Available | |
| Doctrow Steven B | -- | None Available | |
| Doctrow Steven B | $586,500 | Chicago Title Co | |
| Millhouse Robert F | -- | -- |
Source: Public Records
Mortgage History
| Date | Status | Borrower | Loan Amount |
|---|---|---|---|
| Previous Owner | Doctrow Steven B | $468,800 |
Source: Public Records
Tax History Compared to Growth
Tax History
| Year | Tax Paid | Tax Assessment Tax Assessment Total Assessment is a certain percentage of the fair market value that is determined by local assessors to be the total taxable value of land and additions on the property. | Land | Improvement |
|---|---|---|---|---|
| 2025 | $12,489 | $1,058,247 | $393,737 | $664,510 |
| 2024 | $12,489 | $1,037,498 | $386,017 | $651,481 |
| 2023 | $12,193 | $1,017,155 | $378,448 | $638,707 |
| 2022 | $11,763 | $997,211 | $371,027 | $626,184 |
| 2021 | $11,434 | $977,658 | $363,752 | $613,906 |
| 2020 | $11,172 | $967,635 | $360,023 | $607,612 |
| 2019 | $10,789 | $948,663 | $352,964 | $595,699 |
| 2018 | $10,525 | $930,063 | $346,044 | $584,019 |
| 2017 | $10,276 | $911,827 | $339,259 | $572,568 |
| 2016 | $10,140 | $893,949 | $332,607 | $561,342 |
| 2015 | $9,939 | $880,523 | $327,612 | $552,911 |
| 2014 | $9,443 | $832,376 | $321,195 | $511,181 |
Source: Public Records
Map
Nearby Homes
- 5449 S Rim St
- 4953 Kilburn Ct
- 5076 Island Forest Place
- 785 Trousdale St
- 5001 Lakeview Canyon Rd
- 5034 Evanwood Ave
- 1280 Woodland Grove Ct
- 510 Savona Way
- 4791 Parma Dr
- 1495 N View Dr
- 1677 Plum Hollow Cir
- 4559 Rayburn St
- 5567 Spring Hill Ct
- 4546 Rayburn St
- 5566 Spring Hill Ct
- 819 Riverrock Cir
- 4826 Piedmont Dr
- 817 Sunstone St
- 4445 Golf Course Dr
- 5728 Oak Bend Ln Unit 107
- 1752 Misty Creek Rd
- 1776 Misty Creek Rd
- 5677 Brookmont Terrace Ct
- 1740 Misty Creek Rd
- 5630 Brookmont Terrace Ct
- 5665 Brookmont Terrace Ct
- 5717 Stone Mountain Ln
- 1812 Falling Star Ave
- 1824 Falling Star Ave
- 5623 Hidden Glen Ct
- 1800 Falling Star Ave
- 5642 Brookmont Terrace Ct
- 5642 Brookmont Terrace Ct
- 5729 Stone Mountain Ln
- 5705 Stone Mountain Ln
- 5653 Brookmont Terrace Ct
- 5617 Hidden Glen Ct
- 1836 Falling Star Ave
- 5611 Hidden Glen Ct
- 1806 Smokey Ridge Ave