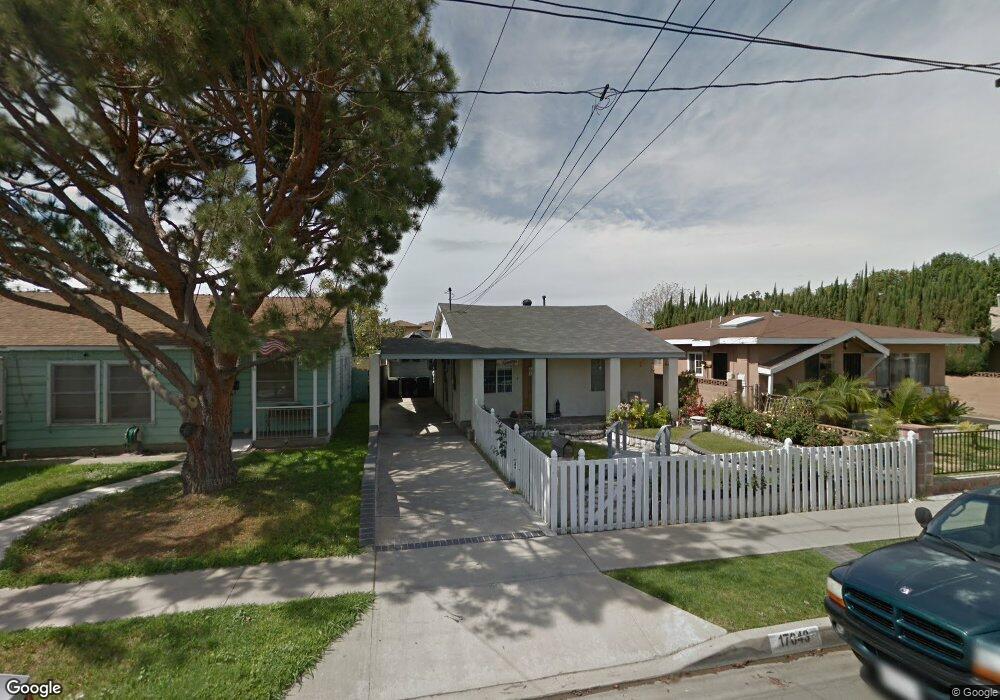
17643 Ardmore Ave Bellflower, CA 90706
Estimated Value: $553,971 - $824,000
2
Beds
1
Bath
720
Sq Ft
$1,015/Sq Ft
Est. Value
About This Home
This home is located at 17643 Ardmore Ave, Bellflower, CA 90706 and is currently estimated at $730,993, approximately $1,015 per square foot. 17643 Ardmore Ave is a home located in Los Angeles County with nearby schools including Craig Williams Elementary School, Mayfair High School, and St. Bernard School.
Ownership History
Date
Name
Owned For
Owner Type
Purchase Details
Closed on
Oct 9, 2015
Sold by
Raya Efren T
Bought by
Raya Efren T and The Efren T Raya Living Trust
Current Estimated Value
Purchase Details
Closed on
Jun 27, 2001
Sold by
Kleinfelter Gordonna Cathleen
Bought by
Raya Efren T
Home Financials for this Owner
Home Financials are based on the most recent Mortgage that was taken out on this home.
Original Mortgage
$173,850
Outstanding Balance
$67,338
Interest Rate
7.21%
Estimated Equity
$663,655
Purchase Details
Closed on
Jul 13, 1994
Sold by
Kleinfelter Robert J and Kleinfelter Gordonna Cathleen
Bought by
Kleinfelter Gordonna Cathleen
Purchase Details
Closed on
Jul 27, 1993
Sold by
Ercse Gordonna Cathleen
Bought by
Ercse Gordonna Cathleen
Home Financials for this Owner
Home Financials are based on the most recent Mortgage that was taken out on this home.
Original Mortgage
$35,000
Interest Rate
7.34%
Create a Home Valuation Report for This Property
The Home Valuation Report is an in-depth analysis detailing your home's value as well as a comparison with similar homes in the area
Home Values in the Area
Average Home Value in this Area
Purchase History
| Date | Buyer | Sale Price | Title Company |
|---|---|---|---|
| Raya Efren T | -- | None Available | |
| Raya Efren T | $183,000 | North American Title Co | |
| Kleinfelter Gordonna Cathleen | -- | -- | |
| Ercse Gordonna Cathleen | -- | Gateway Title Company |
Source: Public Records
Mortgage History
| Date | Status | Borrower | Loan Amount |
|---|---|---|---|
| Open | Raya Efren T | $173,850 | |
| Previous Owner | Ercse Gordonna Cathleen | $35,000 |
Source: Public Records
Tax History
| Year | Tax Paid | Tax Assessment Tax Assessment Total Assessment is a certain percentage of the fair market value that is determined by local assessors to be the total taxable value of land and additions on the property. | Land | Improvement |
|---|---|---|---|---|
| 2025 | $3,377 | $270,321 | $132,943 | $137,378 |
| 2024 | $3,377 | $265,022 | $130,337 | $134,685 |
| 2023 | $3,245 | $259,827 | $127,782 | $132,045 |
| 2022 | $3,183 | $254,733 | $125,277 | $129,456 |
| 2021 | $3,117 | $249,739 | $122,821 | $126,918 |
| 2019 | $3,034 | $242,333 | $119,179 | $123,154 |
| 2018 | $2,925 | $237,583 | $116,843 | $120,740 |
| 2016 | $2,804 | $228,358 | $112,306 | $116,052 |
| 2015 | $2,746 | $224,929 | $110,620 | $114,309 |
| 2014 | $2,711 | $220,524 | $108,454 | $112,070 |
Source: Public Records
Map
Nearby Homes
- 6118 Amos Ave
- 9319 Cedar St Unit C
- 9261 Cedar St
- 6127 Adenmoor Ave
- 9725 Arkansas St
- 9240 Palm St
- 17046 Clark Ave
- 9133 Ramona St Unit 2
- 9929 Park St
- 16919 Ardmore Ave
- 5942 Fidler Ave
- 6007 Coldbrook Ave
- 16822 Ardmore Ave
- 9116 Palm St
- 10117 Palm St
- 5851 Premiere Ave
- 4415 Ashworth St
- 9545 Flower St
- 9559 Flower St
- 16924 Bixby Ave
- 17641 Ardmore Ave
- 17655 Ardmore Ave
- 17635 Ardmore Ave
- 9563 Cedar St
- 9573 Cedar St
- 9553 Cedar St
- 17642 Ardmore Ave
- 17656 Ardmore Ave
- 17626 Ardmore Ave
- 17636 Ardmore Ave
- 17632 Ardmore Ave
- 9570 Cedar St
- 9541 Cedar St
- 9602 Cedar St
- 9554 Cedar St
- 9554 Ramona St
- 9606 Cedar St
- 17813 Ardmore Ave
- 17812 Ardmore Ave
- 9540 Cedar St
Your Personal Tour Guide
Ask me questions while you tour the home.