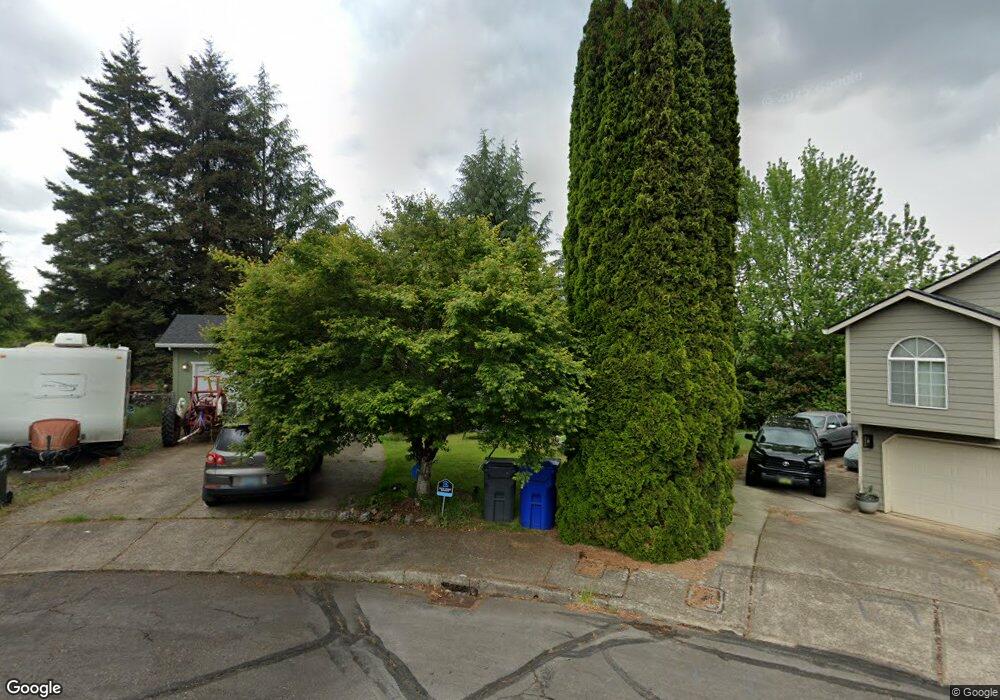
1765 Kathy Ct S Salem, OR 97306
Sunnyslope NeighborhoodEstimated Value: $521,000 - $582,000
5
Beds
3
Baths
2,464
Sq Ft
$220/Sq Ft
Est. Value
About This Home
This home is located at 1765 Kathy Ct S, Salem, OR 97306 and is currently estimated at $541,944, approximately $219 per square foot. 1765 Kathy Ct S is a home located in Marion County with nearby schools including Liberty Elementary School, Crossler Middle School, and Sprague High School.
Ownership History
Date
Name
Owned For
Owner Type
Purchase Details
Closed on
Sep 3, 2015
Sold by
Gargiulo Joseph
Bought by
Butler Winona Gustava
Current Estimated Value
Purchase Details
Closed on
Feb 28, 2012
Sold by
Swanson Alice P
Bought by
Butler Gargiulo Winona G and Gargiulo Joseph
Home Financials for this Owner
Home Financials are based on the most recent Mortgage that was taken out on this home.
Original Mortgage
$157,964
Interest Rate
3.83%
Mortgage Type
New Conventional
Purchase Details
Closed on
Jan 24, 2006
Sold by
Lund Harry L
Bought by
Swanson Alice P and Swanson Gail N
Home Financials for this Owner
Home Financials are based on the most recent Mortgage that was taken out on this home.
Original Mortgage
$199,920
Interest Rate
7.97%
Mortgage Type
Fannie Mae Freddie Mac
Purchase Details
Closed on
Sep 20, 2002
Sold by
Hayes David L
Bought by
Lund Harry L
Home Financials for this Owner
Home Financials are based on the most recent Mortgage that was taken out on this home.
Original Mortgage
$179,520
Interest Rate
6.16%
Mortgage Type
VA
Create a Home Valuation Report for This Property
The Home Valuation Report is an in-depth analysis detailing your home's value as well as a comparison with similar homes in the area
Home Values in the Area
Average Home Value in this Area
Purchase History
| Date | Buyer | Sale Price | Title Company |
|---|---|---|---|
| Butler Winona Gustava | -- | None Available | |
| Butler Gargiulo Winona G | $160,000 | Amerititle | |
| Swanson Alice P | $249,900 | Amerititle | |
| Lund Harry L | $176,000 | Fidelity National Title Co |
Source: Public Records
Mortgage History
| Date | Status | Borrower | Loan Amount |
|---|---|---|---|
| Previous Owner | Butler Gargiulo Winona G | $157,964 | |
| Previous Owner | Swanson Alice P | $199,920 | |
| Previous Owner | Lund Harry L | $179,520 |
Source: Public Records
Tax History Compared to Growth
Tax History
| Year | Tax Paid | Tax Assessment Tax Assessment Total Assessment is a certain percentage of the fair market value that is determined by local assessors to be the total taxable value of land and additions on the property. | Land | Improvement |
|---|---|---|---|---|
| 2025 | $4,732 | $248,250 | -- | -- |
| 2024 | $4,732 | $241,020 | -- | -- |
| 2023 | $4,593 | $234,000 | $0 | $0 |
| 2022 | $4,330 | $227,190 | $0 | $0 |
| 2021 | $4,207 | $220,580 | $0 | $0 |
| 2020 | $4,084 | $214,160 | $0 | $0 |
| 2019 | $3,941 | $207,930 | $0 | $0 |
| 2018 | $4,010 | $0 | $0 | $0 |
| 2017 | $3,619 | $0 | $0 | $0 |
| 2016 | $3,448 | $0 | $0 | $0 |
| 2015 | $3,474 | $0 | $0 | $0 |
| 2014 | $3,362 | $0 | $0 | $0 |
Source: Public Records
Map
Nearby Homes
- 1884 Skyline Village Loop S
- 4835 Talisman Ct S
- 5198 Skyline Rd S
- 1878 Joseph St S
- 5275 Parker Ct S
- 5270 Chapman St S
- 1556 Joplin St S
- 2217 Juliet Ct S
- 5125 Mountain Crest Way S
- 1874 Cedarcrest Dr S
- 5285 Anaconda Dr S
- 2280 Kuebler Blvd
- 2280 Kuebler Rd S
- 5441 Mohawk Ct S
- 5042 Cumberland Ct SE Unit 18
- 4664 17th Ave S
- 5401 E Ridge St S
- 1977 Maplewood Ct S
- 5395 Anaconda Dr S
- 2335 Maplewood Dr S
- 1735 Kathy Ct S
- 1760 Kathy Ct S
- 1695 Kathy Ct S
- 1730 Kathy Ct S
- 1855 & 1859 Skyline Ct S
- 1855 Skyline Ct S
- 1690 Kathy Ct S
- 1859 Skyline Ct S
- 1855 Skyline Ct S Unit 1859
- 1855 Skyline (1859) Ct S
- 5111 Zosel Ave S
- 1665 Kathy Ct S
- 5000 Skyline Rd S
- 1865 Skyline Ct S Unit 1869
- 1845 Skyline Ct S Unit 1849
- 000 Skyline Rd S
- 00 Skyline Rd S
- 0 Skyline Rd S
- 0 Skyline Rd S Unit 798307
- 0 Skyline Rd S Unit 22089474