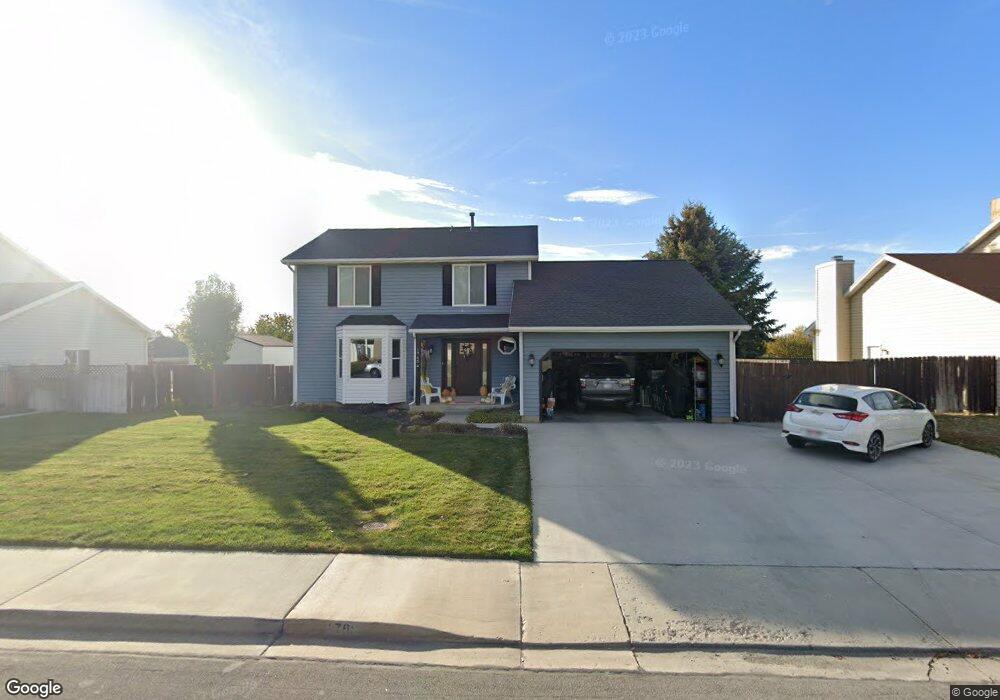
1765 N 80 W Orem, UT 84057
Northridge NeighborhoodEstimated Value: $542,000 - $592,000
3
Beds
3
Baths
1,886
Sq Ft
$300/Sq Ft
Est. Value
About This Home
This home is located at 1765 N 80 W, Orem, UT 84057 and is currently estimated at $566,043, approximately $300 per square foot. 1765 N 80 W is a home located in Utah County with nearby schools including Northridge Elementary School, Oak Canyon Junior High School, and Timpanogos High School.
Ownership History
Date
Name
Owned For
Owner Type
Purchase Details
Closed on
Aug 23, 2021
Sold by
Kearns Michelle L
Bought by
Kearns Michelle
Current Estimated Value
Home Financials for this Owner
Home Financials are based on the most recent Mortgage that was taken out on this home.
Original Mortgage
$392,000
Outstanding Balance
$355,912
Interest Rate
2.8%
Mortgage Type
New Conventional
Estimated Equity
$210,131
Purchase Details
Closed on
Sep 15, 2016
Sold by
Kearns Michelle Lee and Kearns Michelle L
Bought by
Kearns Michelle L
Home Financials for this Owner
Home Financials are based on the most recent Mortgage that was taken out on this home.
Original Mortgage
$205,600
Interest Rate
3.43%
Mortgage Type
New Conventional
Purchase Details
Closed on
Aug 21, 2002
Sold by
Vincent Hollis H and Vincent Joni O
Bought by
Hollis H Carolyn
Purchase Details
Closed on
Jun 6, 1997
Sold by
Hollis Carolyn
Bought by
Hollis H Carolyn and Vincent Joni O
Create a Home Valuation Report for This Property
The Home Valuation Report is an in-depth analysis detailing your home's value as well as a comparison with similar homes in the area
Home Values in the Area
Average Home Value in this Area
Purchase History
| Date | Buyer | Sale Price | Title Company |
|---|---|---|---|
| Kearns Michelle | -- | Skyline Title Llc | |
| Kearns Michelle L | -- | Fidelity Natl Title Solu | |
| Hollis H Carolyn | -- | First American Title Co | |
| Hollis H Carolyn | -- | First American Title | |
| Hollis Carolyn | -- | First American Title |
Source: Public Records
Mortgage History
| Date | Status | Borrower | Loan Amount |
|---|---|---|---|
| Open | Kearns Michelle | $392,000 | |
| Closed | Kearns Michelle L | $205,600 |
Source: Public Records
Tax History
| Year | Tax Paid | Tax Assessment Tax Assessment Total Assessment is a certain percentage of the fair market value that is determined by local assessors to be the total taxable value of land and additions on the property. | Land | Improvement |
|---|---|---|---|---|
| 2025 | $2,236 | $284,020 | -- | -- |
| 2024 | $2,236 | $273,405 | $0 | $0 |
| 2023 | $2,100 | $275,935 | $0 | $0 |
| 2022 | $2,068 | $263,285 | $0 | $0 |
| 2021 | $1,813 | $349,700 | $150,000 | $199,700 |
| 2020 | $1,666 | $315,800 | $120,000 | $195,800 |
| 2019 | $1,473 | $290,300 | $120,000 | $170,300 |
| 2018 | $1,477 | $278,200 | $113,100 | $165,100 |
| 2017 | $1,330 | $134,200 | $0 | $0 |
| 2016 | -- | $128,260 | $0 | $0 |
| 2015 | $1,445 | $127,160 | $0 | $0 |
| 2014 | $1,281 | $112,200 | $0 | $0 |
Source: Public Records
Map
Nearby Homes
- 49 W 1880 N
- 92 W 1565 N
- 1744 N 280 W
- 1638 N 160 E
- 1636 N 160 E
- 1547 N 275 West St Unit 5
- 1566 N 275 West St Unit 1
- 1548 N 275 West St Unit 2
- 287 W 1380 N
- 332 W Amiron Way Unit D
- 1461 N Amiron Way Unit B
- 1916 N 430 W
- 363 E 1395 N Unit 22
- 98 S 1025 E
- 442 E 1730 N
- 127 S 400 E
- 1371 N 330 E Unit 8
- 1480 N 430 E
- 1948 N 520 W
- 1545 N State St Unit 1
Your Personal Tour Guide
Ask me questions while you tour the home.