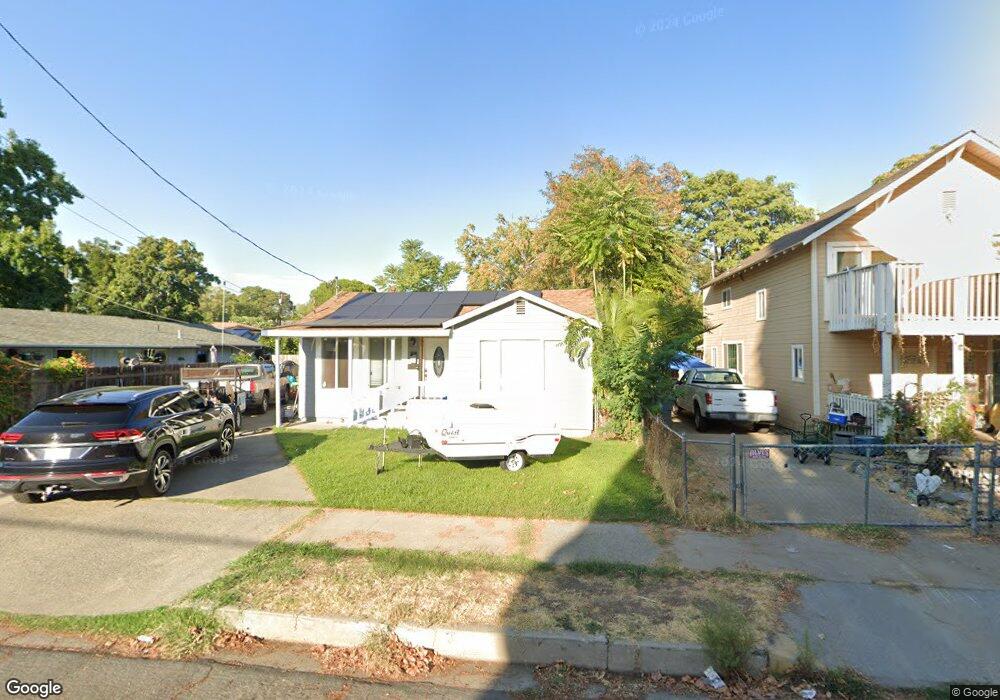
1765 Veatch St Oroville, CA 95965
Estimated Value: $221,799 - $269,000
3
Beds
1
Bath
1,265
Sq Ft
$199/Sq Ft
Est. Value
About This Home
This home is located at 1765 Veatch St, Oroville, CA 95965 and is currently estimated at $251,950, approximately $199 per square foot. 1765 Veatch St is a home located in Butte County with nearby schools including Oroville High School, Ipakanni Early College Charter School, and Come Back Butte Charter School.
Ownership History
Date
Name
Owned For
Owner Type
Purchase Details
Closed on
Jul 1, 2020
Sold by
Seruby David Mak and Seruby Vickie Lee
Bought by
Meredith Donald P and Harlan Alysia D
Current Estimated Value
Home Financials for this Owner
Home Financials are based on the most recent Mortgage that was taken out on this home.
Original Mortgage
$159,000
Outstanding Balance
$141,252
Interest Rate
3.2%
Mortgage Type
Commercial
Estimated Equity
$110,698
Purchase Details
Closed on
Apr 7, 2004
Sold by
Scruby David M and Scruby Vickie L
Bought by
Scruby David Max
Create a Home Valuation Report for This Property
The Home Valuation Report is an in-depth analysis detailing your home's value as well as a comparison with similar homes in the area
Home Values in the Area
Average Home Value in this Area
Purchase History
| Date | Buyer | Sale Price | Title Company |
|---|---|---|---|
| Meredith Donald P | $169,000 | None Available | |
| Scruby David Max | -- | -- |
Source: Public Records
Mortgage History
| Date | Status | Borrower | Loan Amount |
|---|---|---|---|
| Open | Meredith Donald P | $159,000 |
Source: Public Records
Tax History
| Year | Tax Paid | Tax Assessment Tax Assessment Total Assessment is a certain percentage of the fair market value that is determined by local assessors to be the total taxable value of land and additions on the property. | Land | Improvement |
|---|---|---|---|---|
| 2025 | $2,588 | $182,928 | $81,181 | $101,747 |
| 2024 | $2,588 | $179,342 | $79,590 | $99,752 |
| 2023 | $2,524 | $175,827 | $78,030 | $97,797 |
| 2022 | $2,412 | $172,380 | $76,500 | $95,880 |
| 2021 | $2,356 | $169,000 | $75,000 | $94,000 |
| 2020 | $1,357 | $80,278 | $21,889 | $58,389 |
| 2019 | $1,343 | $78,705 | $21,460 | $57,245 |
| 2018 | $1,307 | $77,163 | $21,040 | $56,123 |
| 2017 | $1,279 | $75,651 | $20,628 | $55,023 |
| 2016 | $1,261 | $74,169 | $20,224 | $53,945 |
| 2015 | $1,204 | $73,056 | $19,921 | $53,135 |
| 2014 | $1,161 | $71,626 | $19,531 | $52,095 |
Source: Public Records
Map
Nearby Homes
Your Personal Tour Guide
Ask me questions while you tour the home.