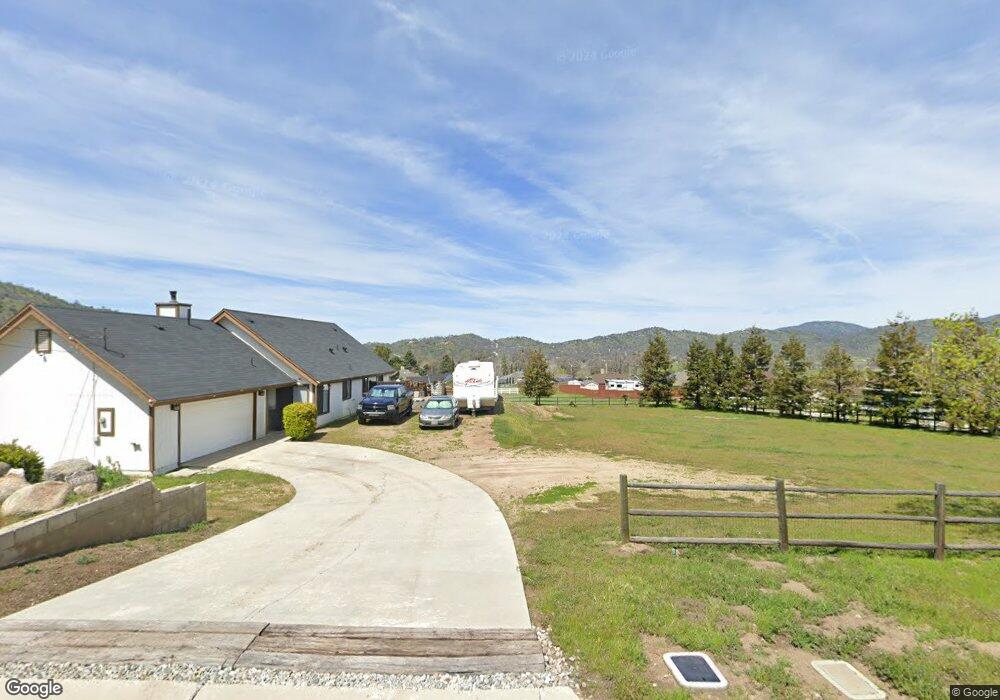
17651 Bold Venture Dr Tehachapi, CA 93561
Estimated Value: $348,480 - $381,000
3
Beds
2
Baths
1,352
Sq Ft
$265/Sq Ft
Est. Value
About This Home
This home is located at 17651 Bold Venture Dr, Tehachapi, CA 93561 and is currently estimated at $357,620, approximately $264 per square foot. 17651 Bold Venture Dr is a home located in Kern County with nearby schools including Cummings Valley Elementary School, Jacobsen Middle School, and Tehachapi High School.
Ownership History
Date
Name
Owned For
Owner Type
Purchase Details
Closed on
Jan 17, 2001
Sold by
Federal National Mortgage Association
Bought by
Stanley Trevor A
Current Estimated Value
Home Financials for this Owner
Home Financials are based on the most recent Mortgage that was taken out on this home.
Original Mortgage
$83,600
Interest Rate
7.41%
Purchase Details
Closed on
Sep 13, 2000
Sold by
Chambers Rodger and Chambers Rosemary
Bought by
Federal National Mortgage Association
Purchase Details
Closed on
Feb 9, 1996
Sold by
Batcha Thomas John and Batcha Joyce Evelyn
Bought by
Chambers Rodger and Chambers Rosemary
Home Financials for this Owner
Home Financials are based on the most recent Mortgage that was taken out on this home.
Original Mortgage
$97,850
Interest Rate
7.01%
Create a Home Valuation Report for This Property
The Home Valuation Report is an in-depth analysis detailing your home's value as well as a comparison with similar homes in the area
Home Values in the Area
Average Home Value in this Area
Purchase History
| Date | Buyer | Sale Price | Title Company |
|---|---|---|---|
| Stanley Trevor A | $88,000 | First American Title Co | |
| Federal National Mortgage Association | $89,000 | First American Title Co | |
| Chambers Rodger | $103,000 | Chicago Title Co |
Source: Public Records
Mortgage History
| Date | Status | Borrower | Loan Amount |
|---|---|---|---|
| Closed | Stanley Trevor A | $83,600 | |
| Previous Owner | Chambers Rodger | $97,850 |
Source: Public Records
Tax History
| Year | Tax Paid | Tax Assessment Tax Assessment Total Assessment is a certain percentage of the fair market value that is determined by local assessors to be the total taxable value of land and additions on the property. | Land | Improvement |
|---|---|---|---|---|
| 2025 | $1,839 | $132,578 | $15,055 | $117,523 |
| 2024 | $1,779 | $129,979 | $14,760 | $115,219 |
| 2023 | $1,779 | $127,431 | $14,471 | $112,960 |
| 2022 | $1,757 | $124,934 | $14,188 | $110,746 |
| 2021 | $1,710 | $122,485 | $13,910 | $108,575 |
| 2020 | $1,702 | $121,230 | $13,768 | $107,462 |
| 2019 | $1,700 | $121,230 | $13,768 | $107,462 |
| 2018 | $1,648 | $116,525 | $13,235 | $103,290 |
| 2017 | $1,645 | $114,241 | $12,976 | $101,265 |
| 2016 | $1,556 | $112,002 | $12,722 | $99,280 |
| 2015 | $1,541 | $110,320 | $12,531 | $97,789 |
| 2014 | $1,525 | $108,160 | $12,286 | $95,874 |
Source: Public Records
Map
Nearby Homes
- 27500 Buckpasser Dr
- 0 Bold Venture Unit WS24098286
- 17401 Bold Venture Dr
- 17750 Arlington Place
- 17820 Bold Venture Dr
- 17751 Arlington Place
- 17841 Hambletonian Dr
- 18130 Bold Venture Dr
- 18140 Bold Venture Dr
- 17701 Bold Venture Dr
- 17161 Bold Venture Dr
- 18140 Flare Dr
- 27712 Stallion Springs Dr
- 27961 Stallion Springs Dr
- 28151 Preakness Dr
- 18101 Ghost Town St
- 18400 Branding Iron Ct
- 18461 Branding Iron Ct
- 28261 Preakness Dr
- 28341 Carry Back Ct
- 17641 Bold Venture Dr
- 17600 Bold Venture Dr
- 17601 Bold Venture Dr
- 17551 Bold Venture Dr
- 17660 Bold Venture Dr
- 27540 Buckpasser Dr
- 17650 Bold Venture Dr
- 17600 Arlington Place
- 27560 Buckpasser Dr
- 17620 Bold Venture Dr
- 27541 Buckpasser Dr
- 17630 Arlington Place
- 17570 Bold Venture Dr
- 17640 Bold Venture Dr
- 27501 Buckpasser Dr
- 27551 Buckpasser Dr
- 17541 Bold Venture Dr
- 17700 Bold Venture Dr
- 27600 Buckpasser Dr
- 17560 Bold Venture Dr
Your Personal Tour Guide
Ask me questions while you tour the home.