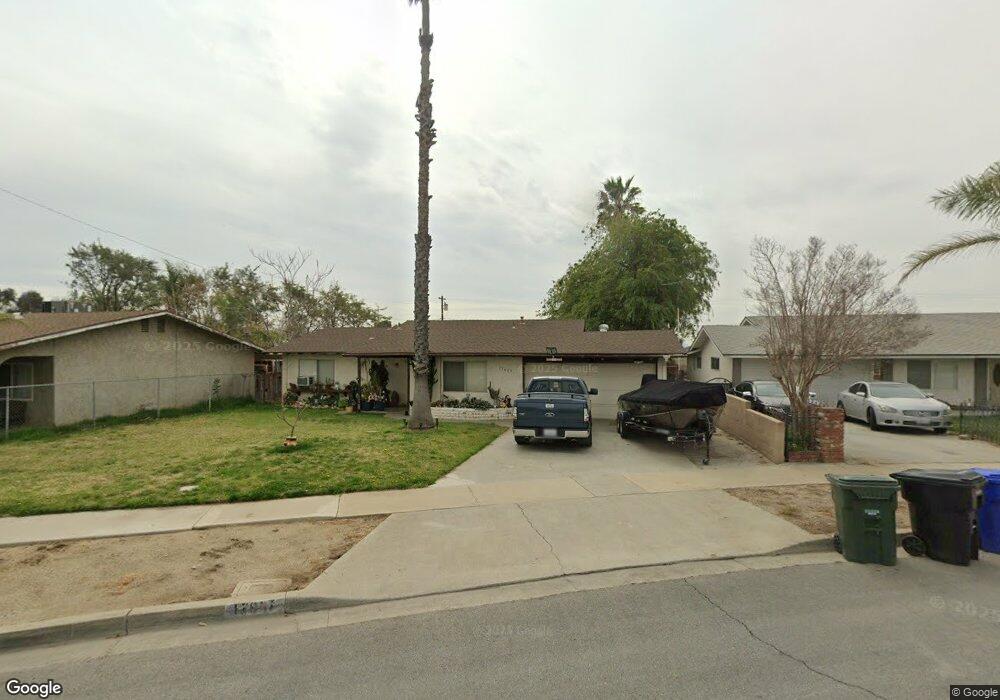
17657 Seville Ct Fontana, CA 92335
Estimated Value: $513,361 - $598,000
3
Beds
2
Baths
1,313
Sq Ft
$421/Sq Ft
Est. Value
About This Home
This home is located at 17657 Seville Ct, Fontana, CA 92335 and is currently estimated at $553,090, approximately $421 per square foot. 17657 Seville Ct is a home located in San Bernardino County with nearby schools including South Tamarind Elementary School, Fontana Middle School, and Fontana High School.
Ownership History
Date
Name
Owned For
Owner Type
Purchase Details
Closed on
Dec 11, 1998
Sold by
Va
Bought by
Barnick John P
Current Estimated Value
Home Financials for this Owner
Home Financials are based on the most recent Mortgage that was taken out on this home.
Original Mortgage
$58,280
Outstanding Balance
$13,387
Interest Rate
6.91%
Mortgage Type
Seller Take Back
Estimated Equity
$539,703
Purchase Details
Closed on
Dec 10, 1998
Sold by
Barnick Elizabeth
Bought by
Barnick John P
Home Financials for this Owner
Home Financials are based on the most recent Mortgage that was taken out on this home.
Original Mortgage
$58,280
Outstanding Balance
$13,387
Interest Rate
6.91%
Mortgage Type
Seller Take Back
Estimated Equity
$539,703
Purchase Details
Closed on
Mar 6, 1998
Sold by
Hall David L and Hall Sarah A
Bought by
Countrywide Home Loans Inc
Purchase Details
Closed on
Oct 28, 1997
Sold by
Countrywide Home Loans Inc
Bought by
Va
Create a Home Valuation Report for This Property
The Home Valuation Report is an in-depth analysis detailing your home's value as well as a comparison with similar homes in the area
Home Values in the Area
Average Home Value in this Area
Purchase History
| Date | Buyer | Sale Price | Title Company |
|---|---|---|---|
| Barnick John P | $82,500 | First American Title Ins Co | |
| Barnick John P | -- | First American Title Ins Co | |
| Countrywide Home Loans Inc | $79,975 | Landsafe Title | |
| Va | -- | Landsafe Title |
Source: Public Records
Mortgage History
| Date | Status | Borrower | Loan Amount |
|---|---|---|---|
| Open | Barnick John P | $58,280 |
Source: Public Records
Tax History Compared to Growth
Tax History
| Year | Tax Paid | Tax Assessment Tax Assessment Total Assessment is a certain percentage of the fair market value that is determined by local assessors to be the total taxable value of land and additions on the property. | Land | Improvement |
|---|---|---|---|---|
| 2025 | $2,219 | $128,991 | $32,296 | $96,695 |
| 2024 | $2,219 | $126,462 | $31,663 | $94,799 |
| 2023 | $1,719 | $123,982 | $31,042 | $92,940 |
| 2022 | $1,695 | $121,551 | $30,433 | $91,118 |
| 2021 | $1,671 | $119,167 | $29,836 | $89,331 |
| 2020 | $1,654 | $117,945 | $29,530 | $88,415 |
| 2019 | $1,614 | $115,632 | $28,951 | $86,681 |
| 2018 | $1,615 | $113,364 | $28,383 | $84,981 |
| 2017 | $1,582 | $111,141 | $27,826 | $83,315 |
| 2016 | $1,535 | $108,961 | $27,280 | $81,681 |
| 2015 | $1,500 | $107,324 | $26,870 | $80,454 |
| 2014 | $1,488 | $105,222 | $26,344 | $78,878 |
Source: Public Records
Map
Nearby Homes
- 17655 Vine Ct
- 17394 Seville Ct
- 17425 Arrow Blvd Unit 8
- 17334 Seville Ct
- 17626 Orange Ct
- 8019 Alder Ave
- 17848 17858 Foothill Blvd
- 17903 Dorsey Way
- 18013 Arrow Blvd
- 8560 Buckeye Dr
- 7936 Alder Ave
- 17392 Paine St
- 18045 Foothill Blvd
- 17562 Court St
- 17548 Court St
- 18100 Arrow Blvd
- 7852 Grace Ave
- 17232 Ceres Ave
- 17806 Terry St
- 17196 Barbee St
- 17665 Seville Ave
- 17647 Seville Ct
- 17675 Seville Ave
- 17639 Seville Ct
- 8350 Boxwood Ave
- 17629 Seville Ct
- 17685 Seville Ave
- 17640 Seville Ct
- 17672 Seville Ave
- 17630 Seville Ct
- 17682 Seville Ave
- 8412 Alder Ave
- 8335 Boxwood Ave
- 17617 Seville Ct
- 8330 Boxwood Ave
- 17635 Owen Ct
- 17620 Seville Ct
- 8336 Alder Ave
- 17611 Seville Ct
- 8325 Boxwood Ave