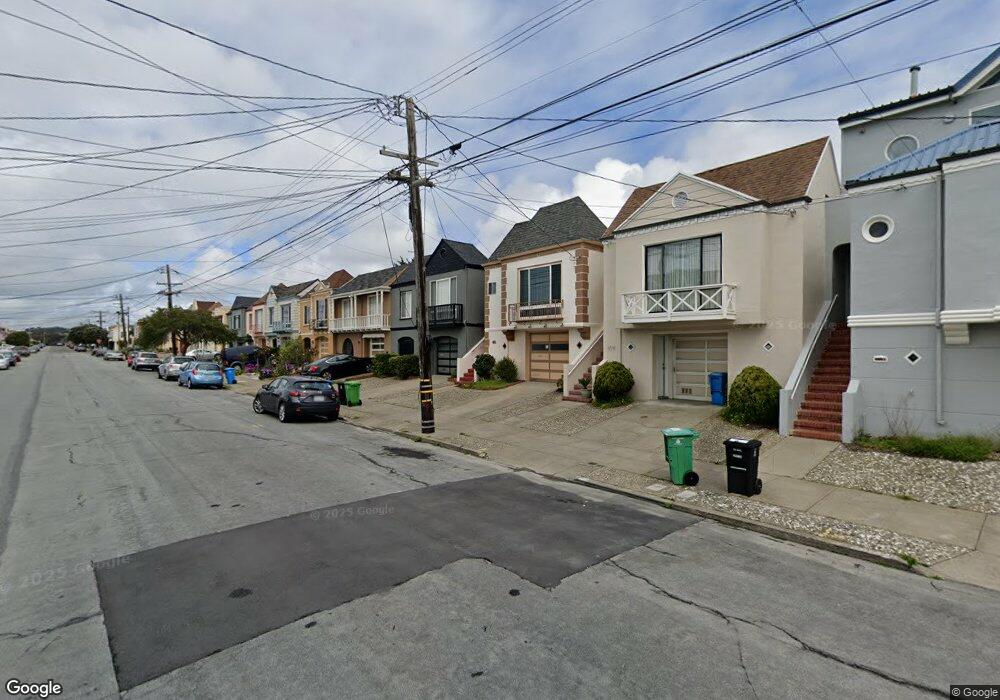
1766 41st Ave San Francisco, CA 94122
Outer Sunset NeighborhoodEstimated Value: $1,336,077 - $1,495,000
2
Beds
2
Baths
1,150
Sq Ft
$1,211/Sq Ft
Est. Value
About This Home
This home is located at 1766 41st Ave, San Francisco, CA 94122 and is currently estimated at $1,392,769, approximately $1,211 per square foot. 1766 41st Ave is a home located in San Francisco County with nearby schools including Key (Francis Scott) Elementary School, Giannini (A.P.) Middle School, and Holy Name Elementary School.
Ownership History
Date
Name
Owned For
Owner Type
Purchase Details
Closed on
May 23, 2020
Sold by
Yan Heting and Kong Hanwei
Bought by
Yan Heting and Kong Hanwei
Current Estimated Value
Purchase Details
Closed on
Apr 20, 1999
Sold by
Howard Florence H Trustee
Bought by
Yan Heting and Kong Han Wei
Home Financials for this Owner
Home Financials are based on the most recent Mortgage that was taken out on this home.
Original Mortgage
$238,000
Outstanding Balance
$60,567
Interest Rate
7.1%
Estimated Equity
$1,332,202
Create a Home Valuation Report for This Property
The Home Valuation Report is an in-depth analysis detailing your home's value as well as a comparison with similar homes in the area
Home Values in the Area
Average Home Value in this Area
Purchase History
| Date | Buyer | Sale Price | Title Company |
|---|---|---|---|
| Yan Heting | -- | None Available | |
| Yan Heting | $340,000 | Commonwealth Land Title Co |
Source: Public Records
Mortgage History
| Date | Status | Borrower | Loan Amount |
|---|---|---|---|
| Open | Yan Heting | $238,000 |
Source: Public Records
Tax History
| Year | Tax Paid | Tax Assessment Tax Assessment Total Assessment is a certain percentage of the fair market value that is determined by local assessors to be the total taxable value of land and additions on the property. | Land | Improvement |
|---|---|---|---|---|
| 2025 | $7,337 | $570,136 | $319,803 | $250,333 |
| 2024 | $7,337 | $558,958 | $313,533 | $245,425 |
| 2023 | $7,220 | $548,000 | $307,386 | $240,614 |
| 2022 | $7,071 | $537,256 | $301,359 | $235,897 |
| 2021 | $6,942 | $526,722 | $295,450 | $231,272 |
| 2020 | $7,038 | $521,323 | $292,421 | $228,902 |
| 2019 | $6,752 | $511,103 | $286,688 | $224,415 |
| 2018 | $6,526 | $501,083 | $281,067 | $220,016 |
| 2017 | $5,776 | $459,258 | $275,556 | $183,702 |
| 2016 | $5,661 | $450,253 | $270,153 | $180,100 |
| 2015 | $5,590 | $443,491 | $266,096 | $177,395 |
| 2014 | $5,444 | $434,805 | $260,884 | $173,921 |
Source: Public Records
Map
Nearby Homes
Your Personal Tour Guide
Ask me questions while you tour the home.