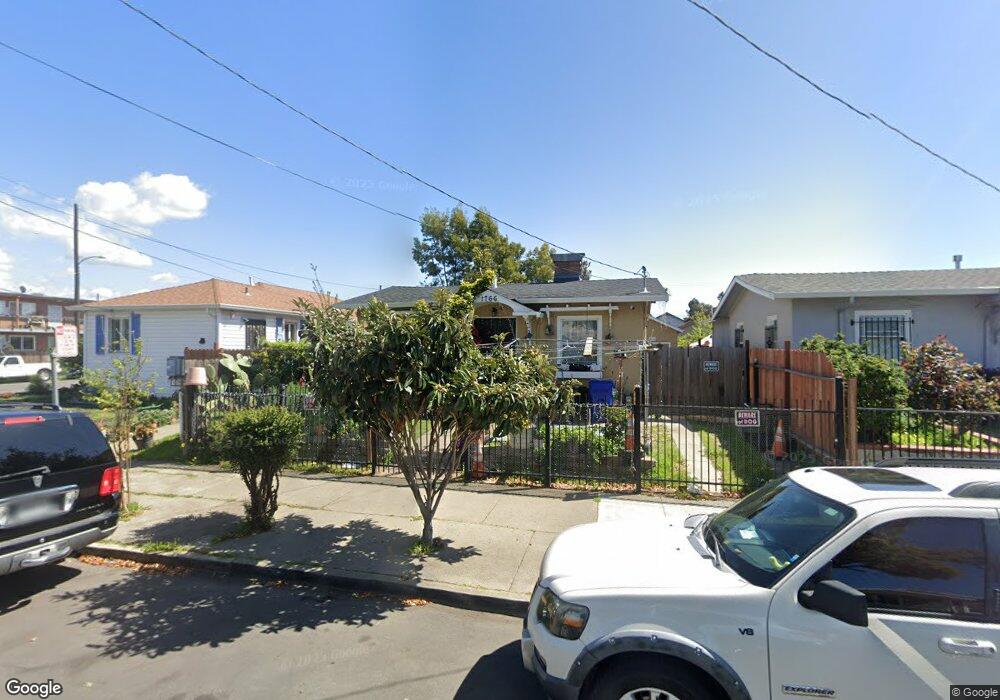
1766 86th Ave Oakland, CA 94621
Webster NeighborhoodEstimated Value: $209,000 - $424,000
2
Beds
2
Baths
732
Sq Ft
$463/Sq Ft
Est. Value
About This Home
This home is located at 1766 86th Ave, Oakland, CA 94621 and is currently estimated at $338,611, approximately $462 per square foot. 1766 86th Ave is a home located in Alameda County with nearby schools including East Oakland Pride Elementary School, Elmhurst United Middle School, and Coliseum College Prep Academy.
Ownership History
Date
Name
Owned For
Owner Type
Purchase Details
Closed on
Dec 9, 2013
Sold by
Lopez Jose M
Bought by
Lopez Mayra G Aguiar
Current Estimated Value
Purchase Details
Closed on
Jul 9, 2012
Sold by
Catalan Heladio and Jaimes Meli
Bought by
Community Fund Llc
Purchase Details
Closed on
Nov 15, 2004
Sold by
Williamson Deshannon
Bought by
Catalan Heladio and Jaimes Meli
Home Financials for this Owner
Home Financials are based on the most recent Mortgage that was taken out on this home.
Original Mortgage
$310,400
Interest Rate
5.79%
Mortgage Type
Purchase Money Mortgage
Purchase Details
Closed on
Jun 15, 2004
Sold by
Castro Gary
Bought by
Williamson Deshannon
Home Financials for this Owner
Home Financials are based on the most recent Mortgage that was taken out on this home.
Original Mortgage
$208,000
Interest Rate
6.09%
Mortgage Type
Stand Alone First
Purchase Details
Closed on
Jun 14, 2004
Sold by
Williamson Vanessa
Bought by
Williamson Deshannon
Home Financials for this Owner
Home Financials are based on the most recent Mortgage that was taken out on this home.
Original Mortgage
$208,000
Interest Rate
6.09%
Mortgage Type
Stand Alone First
Purchase Details
Closed on
Mar 27, 2003
Sold by
Cutts Kelli R
Bought by
Castro Gary
Purchase Details
Closed on
Sep 27, 1995
Sold by
Castro Gary
Bought by
Cutts Kelli R
Home Financials for this Owner
Home Financials are based on the most recent Mortgage that was taken out on this home.
Original Mortgage
$52,000
Interest Rate
7.97%
Purchase Details
Closed on
Jul 28, 1994
Sold by
Soares Walter G
Bought by
Fairway Land Company Inc
Home Financials for this Owner
Home Financials are based on the most recent Mortgage that was taken out on this home.
Original Mortgage
$32,360
Interest Rate
8.51%
Mortgage Type
Seller Take Back
Create a Home Valuation Report for This Property
The Home Valuation Report is an in-depth analysis detailing your home's value as well as a comparison with similar homes in the area
Home Values in the Area
Average Home Value in this Area
Purchase History
| Date | Buyer | Sale Price | Title Company |
|---|---|---|---|
| Lopez Mayra G Aguiar | -- | Pacific Coast Title Company | |
| Aguiar Francisco | -- | Pacific Coast Title Company | |
| Aguiar Aguiar Francisco Francisco | $153,000 | Pacific Coast Title Company | |
| Community Fund Llc | $76,000 | None Available | |
| Catalan Heladio | $320,000 | Fidelity National Title Co | |
| Williamson Deshannon | $260,000 | Commonwealth Land Title | |
| Williamson Deshannon | -- | Commonwealth Land Title Co | |
| Castro Gary | -- | Chicago Title Company | |
| Cutts Kelli R | -- | American Title Ins Co | |
| Cutts Kelli R | $52,000 | American Title Ins Co | |
| Fairway Land Company Inc | $40,500 | American Title Insurance Co |
Source: Public Records
Mortgage History
| Date | Status | Borrower | Loan Amount |
|---|---|---|---|
| Previous Owner | Catalan Heladio | $310,400 | |
| Previous Owner | Williamson Deshannon | $208,000 | |
| Previous Owner | Cutts Kelli R | $52,000 | |
| Previous Owner | Fairway Land Company Inc | $32,360 |
Source: Public Records
Tax History Compared to Growth
Tax History
| Year | Tax Paid | Tax Assessment Tax Assessment Total Assessment is a certain percentage of the fair market value that is determined by local assessors to be the total taxable value of land and additions on the property. | Land | Improvement |
|---|---|---|---|---|
| 2025 | $4,289 | $187,548 | $56,264 | $131,284 |
| 2024 | $4,289 | $183,871 | $55,161 | $128,710 |
| 2023 | $4,271 | $180,267 | $54,080 | $126,187 |
| 2022 | $4,101 | $176,733 | $53,020 | $123,713 |
| 2021 | $3,797 | $173,268 | $51,980 | $121,288 |
| 2020 | $3,754 | $171,492 | $51,447 | $120,045 |
| 2019 | $3,535 | $168,131 | $50,439 | $117,692 |
| 2018 | $3,465 | $164,835 | $49,450 | $115,385 |
| 2017 | $3,304 | $161,604 | $48,481 | $113,123 |
| 2016 | $3,120 | $158,435 | $47,530 | $110,905 |
| 2015 | $3,101 | $156,056 | $46,817 | $109,239 |
| 2014 | $3,045 | $153,000 | $45,900 | $107,100 |
Source: Public Records
Map
Nearby Homes