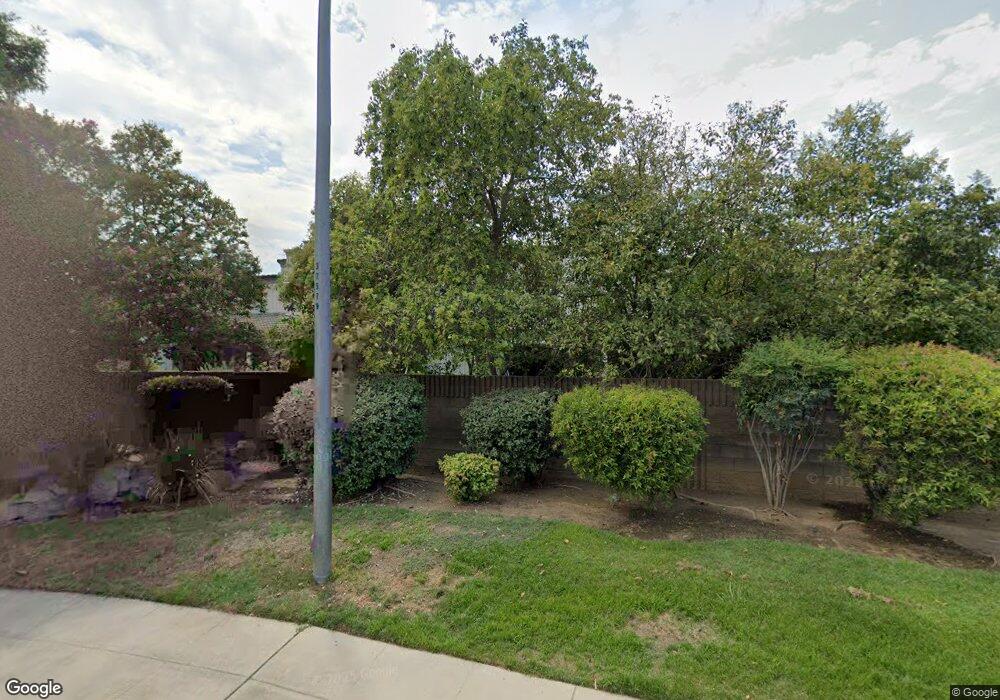
1766 Tollhouse Ln Clovis, CA 93611
Estimated Value: $307,370 - $356,000
2
Beds
2
Baths
1,225
Sq Ft
$269/Sq Ft
Est. Value
About This Home
This home is located at 1766 Tollhouse Ln, Clovis, CA 93611 and is currently estimated at $329,457, approximately $268 per square foot. 1766 Tollhouse Ln is a home located in Fresno County with nearby schools including Cox Elementary School, Clark Intermediate School, and Clovis High School.
Ownership History
Date
Name
Owned For
Owner Type
Purchase Details
Closed on
Aug 26, 2009
Sold by
Schulz Henry Daniel
Bought by
Velasquez Lydia H
Current Estimated Value
Purchase Details
Closed on
Jun 12, 2002
Sold by
Schulz Helen J
Bought by
Schulz Helen J
Purchase Details
Closed on
Feb 6, 2002
Sold by
Nielsen Gary W and Nielsen Patricia L
Bought by
Schulz Helen J
Home Financials for this Owner
Home Financials are based on the most recent Mortgage that was taken out on this home.
Original Mortgage
$95,100
Interest Rate
6%
Mortgage Type
Purchase Money Mortgage
Purchase Details
Closed on
May 22, 2001
Sold by
Hopkins Patricia L
Bought by
Nielsen Gary W and Nielsen Patricia L
Purchase Details
Closed on
Aug 13, 1997
Sold by
Gilbert Merritt L and Gilbert Fairy A
Bought by
Hopkins Patricia L
Home Financials for this Owner
Home Financials are based on the most recent Mortgage that was taken out on this home.
Original Mortgage
$68,800
Interest Rate
7.43%
Create a Home Valuation Report for This Property
The Home Valuation Report is an in-depth analysis detailing your home's value as well as a comparison with similar homes in the area
Home Values in the Area
Average Home Value in this Area
Purchase History
| Date | Buyer | Sale Price | Title Company |
|---|---|---|---|
| Velasquez Lydia H | $175,000 | First American Title Company | |
| Schulz Helen J | -- | -- | |
| Schulz Helen J | $119,000 | First American Title Ins Co | |
| Nielsen Gary W | -- | -- | |
| Hopkins Patricia L | $86,000 | First American Title Ins Co |
Source: Public Records
Mortgage History
| Date | Status | Borrower | Loan Amount |
|---|---|---|---|
| Previous Owner | Schulz Helen J | $95,100 | |
| Previous Owner | Hopkins Patricia L | $68,800 |
Source: Public Records
Tax History
| Year | Tax Paid | Tax Assessment Tax Assessment Total Assessment is a certain percentage of the fair market value that is determined by local assessors to be the total taxable value of land and additions on the property. | Land | Improvement |
|---|---|---|---|---|
| 2025 | $1,192 | $106,661 | $24,221 | $82,440 |
| 2023 | $1,168 | $102,522 | $23,282 | $79,240 |
| 2022 | $1,128 | $100,513 | $22,826 | $77,687 |
| 2021 | $1,095 | $98,543 | $22,379 | $76,164 |
| 2020 | $1,090 | $97,534 | $22,150 | $75,384 |
| 2019 | $1,067 | $95,622 | $21,716 | $73,906 |
| 2018 | $1,043 | $93,748 | $21,291 | $72,457 |
| 2017 | $1,024 | $91,911 | $20,874 | $71,037 |
| 2016 | $988 | $90,110 | $20,465 | $69,645 |
| 2015 | $972 | $88,757 | $20,158 | $68,599 |
| 2014 | $953 | $87,020 | $19,764 | $67,256 |
Source: Public Records
Map
Nearby Homes
- 1855 Vartikian Ave
- 96 Burgan Ave
- 1498 Escalon Ave
- 1946 Calimyrna Ave
- 2047 Menlo Ave
- 192 N Wathen Ave
- 24 Sunnyside Ave
- 2231 Escalon Ave
- 2034 Wrenwood Ave
- 367 N Raphael Ln Unit 367
- 338 N Filbert Ave
- 1506 Robinwood Ave
- 1234 Burlingame Ave
- 344 McKelvy Ave
- 1203 Bundy Ave
- 1650 Fir Ave
- 1830 Cougar Ln
- 1065 Polson Ave
- 1606 Barstow Ave
- 937 Filbert Ave
- 1764 Tollhouse Ln
- 1762 Tollhouse Ln
- 1767 Escalon Ave
- 1760 Tollhouse Ln
- 1798 Tollhouse Ln
- 1775 Escalon Ave
- 1794 Tollhouse Ln
- 1759 Escalon Ave
- 1785 Escalon Ave
- 1752 Tollhouse Ln
- 1751 Escalon Ave
- 1758 Tollhouse Ln
- 1738 Tollhouse Ln
- 1754 Tollhouse Ln
- 1795 Escalon Ave
- 1756 Tollhouse Ln
- 1736 Tollhouse Ln
- 1753 Tollhouse Ln
- 1743 Escalon Ave
- 1751 Tollhouse Ln
Your Personal Tour Guide
Ask me questions while you tour the home.