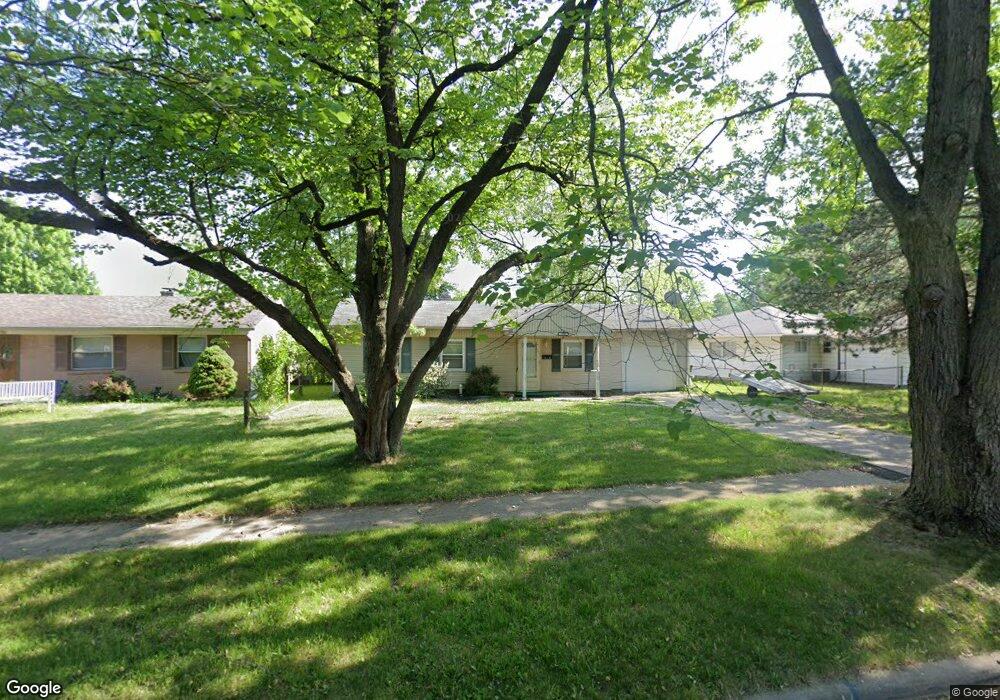
1767 E Benwick Rd Toledo, OH 43613
Whitmer-Trilby NeighborhoodEstimated Value: $131,744 - $153,000
3
Beds
1
Bath
1,127
Sq Ft
$125/Sq Ft
Est. Value
About This Home
This home is located at 1767 E Benwick Rd, Toledo, OH 43613 and is currently estimated at $141,436, approximately $125 per square foot. 1767 E Benwick Rd is a home located in Lucas County with nearby schools including Washington Junior High School, Jefferson Junior High School, and Whitmer High School.
Ownership History
Date
Name
Owned For
Owner Type
Purchase Details
Closed on
May 6, 2020
Sold by
Roemer Paulette
Bought by
Roemer Douglas J
Current Estimated Value
Purchase Details
Closed on
Sep 16, 2019
Sold by
Roemer Donna M
Bought by
Roemer Paulette
Purchase Details
Closed on
Oct 20, 2014
Sold by
Roemer Douglas J
Bought by
Roemer Donna M
Purchase Details
Closed on
Jun 29, 2011
Sold by
Fannie Mae
Bought by
Roemer Douglas J
Purchase Details
Closed on
Oct 18, 2010
Sold by
Bladel Elbert J and Bladel Mary J
Bought by
Federal National Mortgage Association
Purchase Details
Closed on
May 14, 1990
Sold by
Lloyd Nancy Jannie
Create a Home Valuation Report for This Property
The Home Valuation Report is an in-depth analysis detailing your home's value as well as a comparison with similar homes in the area
Home Values in the Area
Average Home Value in this Area
Purchase History
| Date | Buyer | Sale Price | Title Company |
|---|---|---|---|
| Roemer Douglas J | -- | -- | |
| Roemer Paulette | -- | None Available | |
| Roemer Donna M | -- | Chicago Title | |
| Roemer Douglas J | $35,000 | None Available | |
| Federal National Mortgage Association | $48,000 | None Available | |
| -- | $40,000 | -- |
Source: Public Records
Tax History
| Year | Tax Paid | Tax Assessment Tax Assessment Total Assessment is a certain percentage of the fair market value that is determined by local assessors to be the total taxable value of land and additions on the property. | Land | Improvement |
|---|---|---|---|---|
| 2025 | -- | $29,260 | $7,315 | $21,945 |
| 2024 | $958 | $29,260 | $7,315 | $21,945 |
| 2023 | $1,861 | $24,290 | $6,125 | $18,165 |
| 2022 | $1,854 | $24,290 | $6,125 | $18,165 |
| 2021 | $1,879 | $24,290 | $6,125 | $18,165 |
| 2020 | $1,830 | $20,090 | $5,075 | $15,015 |
| 2019 | $1,771 | $20,090 | $5,075 | $15,015 |
| 2018 | $1,610 | $20,090 | $5,075 | $15,015 |
| 2017 | $1,583 | $18,235 | $3,920 | $14,315 |
| 2016 | $1,631 | $52,100 | $11,200 | $40,900 |
| 2015 | $1,587 | $52,100 | $11,200 | $40,900 |
| 2014 | $1,916 | $18,240 | $3,920 | $14,320 |
| 2013 | $1,277 | $18,240 | $3,920 | $14,320 |
Source: Public Records
Map
Nearby Homes
- 1825 Northover Rd
- 1826 Newport Ave
- 1850 W Alexis Rd
- 1760 Ketner Ave
- 1730 Ketner Ave
- 5857 Pickard Dr
- 5836 Curson Dr
- 5228 Rowland Rd
- 6015 Livingston Dr
- 1648 Travis Dr
- 5909 Tetherwood Dr Unit 5909
- 5737 Yermo Dr
- 5147 Oldham Dr
- 1374 Gage Dr
- 5848 Dalton Rd
- 1601 Brooke Park Dr
- 1607 Brooke Park Dr
- 1549 Brooke Park Dr
- 1642 Brooke Park Dr
- 1550 Brooke Park Dr
- 1761 E Benwick Rd
- 5550 S Glastonberry Rd
- 1755 E Benwick Rd
- 5521 Glastonberry Ct
- 1762 E Benwick Rd
- 1772 E Benwick Rd
- 1749 E Benwick Rd
- 5551 S Glastonberry Rd
- 1743 E Benwick Rd
- 5612 S Glastonberry Rd
- 1750 Caxton Ln
- 5524 Glastonberry Ct
- 1811 E Benwick Rd
- 1804 E Benwick Rd
- 1742 E Benwick Rd
- 5620 S Glastonberry Rd
- 1737 E Benwick Rd
- 1746 Caxton Ln
- 1817 E Benwick Rd
- 5609 S Glastonberry Rd
Your Personal Tour Guide
Ask me questions while you tour the home.