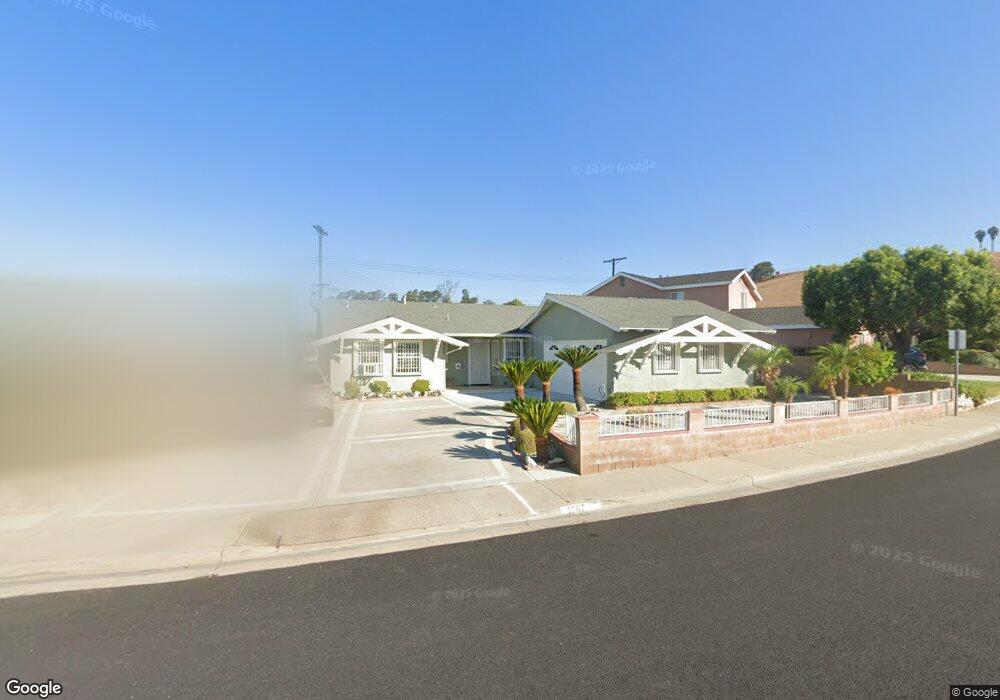
1767 Tyler Dr Monterey Park, CA 91755
Estimated Value: $866,215 - $1,003,000
3
Beds
2
Baths
1,318
Sq Ft
$713/Sq Ft
Est. Value
About This Home
This home is located at 1767 Tyler Dr, Monterey Park, CA 91755 and is currently estimated at $939,554, approximately $712 per square foot. 1767 Tyler Dr is a home located in Los Angeles County with nearby schools including Hillcrest Elementary School, Garvey (Richard) Intermediate School, and Mark Keppel High School.
Ownership History
Date
Name
Owned For
Owner Type
Purchase Details
Closed on
Jun 24, 1996
Sold by
Oliver Geraldine
Bought by
Szeto Yiu Tung and Lee Wai Chun
Current Estimated Value
Home Financials for this Owner
Home Financials are based on the most recent Mortgage that was taken out on this home.
Original Mortgage
$97,400
Interest Rate
8.3%
Purchase Details
Closed on
Apr 16, 1996
Sold by
Wells Fargo Bank National Assn
Bought by
Oliver Geraldine
Home Financials for this Owner
Home Financials are based on the most recent Mortgage that was taken out on this home.
Original Mortgage
$121,600
Interest Rate
7.68%
Purchase Details
Closed on
Mar 7, 1996
Sold by
Sugita Hiroshi and Sugita Kyoko
Bought by
First Interstate Bank Of California
Home Financials for this Owner
Home Financials are based on the most recent Mortgage that was taken out on this home.
Original Mortgage
$121,600
Interest Rate
7.68%
Create a Home Valuation Report for This Property
The Home Valuation Report is an in-depth analysis detailing your home's value as well as a comparison with similar homes in the area
Home Values in the Area
Average Home Value in this Area
Purchase History
| Date | Buyer | Sale Price | Title Company |
|---|---|---|---|
| Szeto Yiu Tung | $195,000 | -- | |
| Oliver Geraldine | $152,000 | First American Title Ins Co | |
| First Interstate Bank Of California | $44,656 | Fidelity National Title Ins |
Source: Public Records
Mortgage History
| Date | Status | Borrower | Loan Amount |
|---|---|---|---|
| Closed | Szeto Yiu Tung | $97,400 | |
| Previous Owner | Oliver Geraldine | $121,600 |
Source: Public Records
Tax History Compared to Growth
Tax History
| Year | Tax Paid | Tax Assessment Tax Assessment Total Assessment is a certain percentage of the fair market value that is determined by local assessors to be the total taxable value of land and additions on the property. | Land | Improvement |
|---|---|---|---|---|
| 2025 | $4,502 | $317,238 | $167,253 | $149,985 |
| 2024 | $4,502 | $311,019 | $163,974 | $147,045 |
| 2023 | $4,355 | $304,921 | $160,759 | $144,162 |
| 2022 | $4,164 | $298,943 | $157,607 | $141,336 |
| 2021 | $4,138 | $293,082 | $154,517 | $138,565 |
| 2019 | $3,987 | $284,391 | $149,935 | $134,456 |
| 2018 | $3,869 | $278,816 | $146,996 | $131,820 |
| 2016 | $3,567 | $267,991 | $141,289 | $126,702 |
| 2015 | $3,496 | $263,966 | $139,167 | $124,799 |
| 2014 | $3,452 | $258,796 | $136,441 | $122,355 |
Source: Public Records
Map
Nearby Homes
- 599 Harrison Rd
- 611 Taylor Dr
- 1947 Palm Ave
- 7210 Tegner Dr
- 2000 Fulton Ave
- 2011 Potrero Grande Dr
- 7319 Berne St
- 1594 Trumbower Ave
- 975 Metro Dr
- 7308 Mooney Dr
- 7217 Mooney Dr
- 2109 Cathryn Dr
- 607 Sefton Ave
- 620 E Graves Ave
- 346 E Graves Ave
- 1021 Mooney Dr
- 1023 Mooney Dr
- 7672 Sunside Dr
- 531 Sefton Ave
- 527 Pomelo Ave Unit E