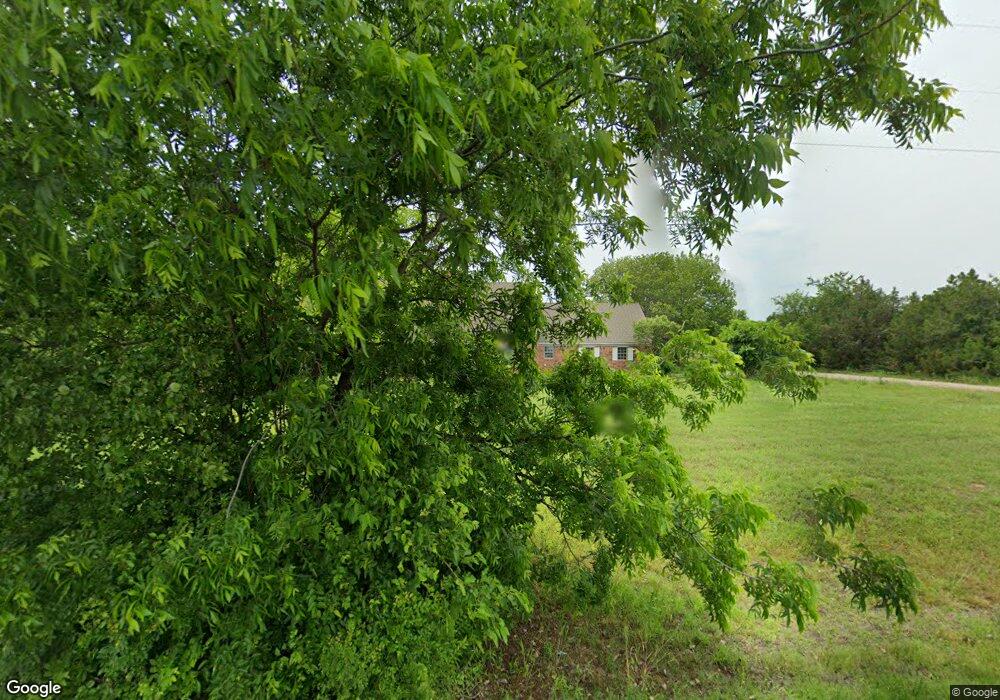
176883 N 2800 Rd Duncan, OK 73533
Estimated Value: $220,299 - $239,000
3
Beds
2
Baths
1,944
Sq Ft
$118/Sq Ft
Est. Value
About This Home
This home is located at 176883 N 2800 Rd, Duncan, OK 73533 and is currently estimated at $230,075, approximately $118 per square foot. 176883 N 2800 Rd is a home located in Stephens County with nearby schools including Comanche Elementary School, Comanche Middle School, and Comanche High School.
Ownership History
Date
Name
Owned For
Owner Type
Purchase Details
Closed on
Sep 28, 2021
Sold by
Bean Robert E and Bean Elizabeth
Bought by
Baker Layle N
Current Estimated Value
Home Financials for this Owner
Home Financials are based on the most recent Mortgage that was taken out on this home.
Original Mortgage
$132,000
Outstanding Balance
$116,563
Interest Rate
2.8%
Mortgage Type
Future Advance Clause Open End Mortgage
Estimated Equity
$113,512
Purchase Details
Closed on
Apr 12, 2011
Sold by
Wiggins David and Wiggins Angela
Bought by
Bean Robert E and Bean Elizabeth
Home Financials for this Owner
Home Financials are based on the most recent Mortgage that was taken out on this home.
Original Mortgage
$121,705
Interest Rate
4.82%
Mortgage Type
FHA
Purchase Details
Closed on
Jan 9, 2003
Sold by
Collinsworth Edith
Purchase Details
Closed on
May 20, 1998
Sold by
Collinsworth Edith
Create a Home Valuation Report for This Property
The Home Valuation Report is an in-depth analysis detailing your home's value as well as a comparison with similar homes in the area
Home Values in the Area
Average Home Value in this Area
Purchase History
| Date | Buyer | Sale Price | Title Company |
|---|---|---|---|
| Baker Layle N | -- | None Listed On Document | |
| Bean Robert E | $135,500 | None Available | |
| -- | $93,000 | -- | |
| -- | -- | -- |
Source: Public Records
Mortgage History
| Date | Status | Borrower | Loan Amount |
|---|---|---|---|
| Open | Baker Layle N | $132,000 | |
| Previous Owner | Bean Robert E | $121,705 |
Source: Public Records
Tax History Compared to Growth
Tax History
| Year | Tax Paid | Tax Assessment Tax Assessment Total Assessment is a certain percentage of the fair market value that is determined by local assessors to be the total taxable value of land and additions on the property. | Land | Improvement |
|---|---|---|---|---|
| 2025 | $1,588 | $18,196 | $834 | $17,362 |
| 2024 | $1,588 | $18,527 | $834 | $17,693 |
| 2023 | $1,539 | $17,987 | $834 | $17,153 |
| 2022 | $1,565 | $18,291 | $834 | $17,457 |
| 2021 | $1,340 | $15,515 | $684 | $14,831 |
| 2020 | $1,275 | $14,920 | $684 | $14,236 |
| 2019 | $1,351 | $15,051 | $684 | $14,367 |
| 2018 | $1,369 | $15,471 | $684 | $14,787 |
| 2017 | $1,160 | $15,306 | $683 | $14,623 |
| 2016 | $1,212 | $14,427 | $660 | $13,767 |
| 2015 | $1,256 | $14,427 | $660 | $13,767 |
| 2014 | $1,256 | $14,427 | $660 | $13,767 |
Source: Public Records
Map
Nearby Homes
- 176883 176883 N 2800 Rd
- 3889 Kensworth Dr
- 177611 N 2800 Rd
- 5204 Kevin Dr
- 177025 N 2810 Rd
- 280350 E 1780 Rd
- 177074 Stephens Dr
- 3655 Lovegrass Ln
- 4705 W Seminole Rd
- 3501 S 13th St
- 1715 S 42nd St
- 1317 S 58th St
- TBD S 27th St
- 177914 177914 N 2770
- ???? S 2nd St
- 0 S 2nd St
- 451 S 11th St
- 1114 1114 S 10th St
- 282096 Andrews Dr
- 1009 W Duncan Ave