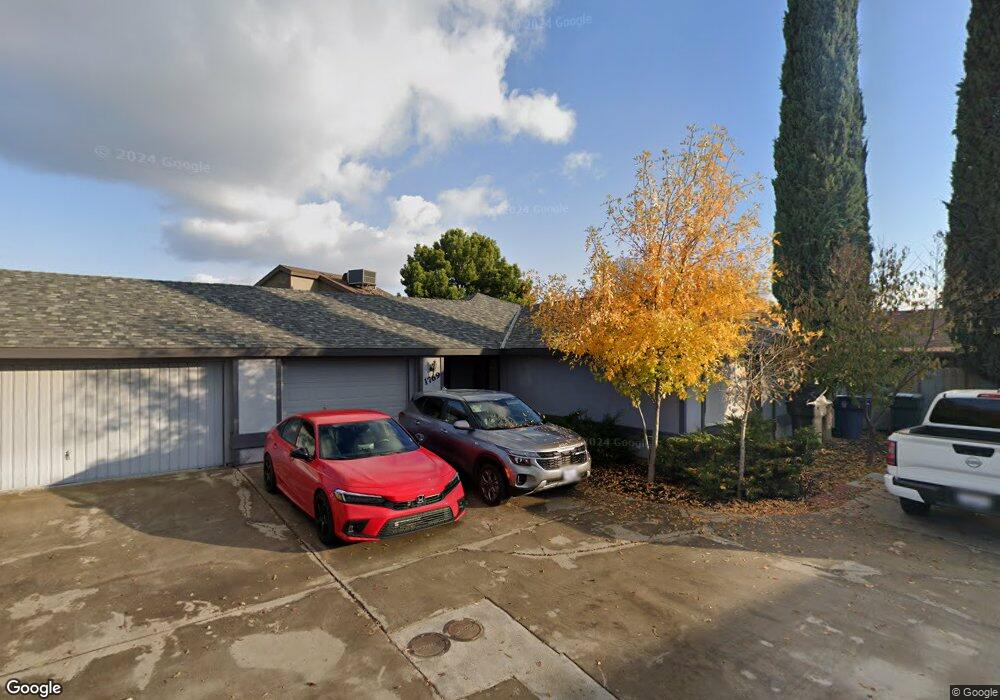
1769 E Cross Ave Tulare, CA 93274
Northeast Tulare NeighborhoodEstimated Value: $227,000 - $343,470
2
Beds
2
Baths
1,132
Sq Ft
$232/Sq Ft
Est. Value
About This Home
This home is located at 1769 E Cross Ave, Tulare, CA 93274 and is currently estimated at $262,118, approximately $231 per square foot. 1769 E Cross Ave is a home located in Tulare County with nearby schools including Mission Valley Elementary School, Live Oak Middle School, and Tulare Union High School.
Ownership History
Date
Name
Owned For
Owner Type
Purchase Details
Closed on
Jul 21, 2020
Sold by
Choboian Manya Evon and The Manya Choboian Trust
Bought by
Lorenzo Kimberly Valov
Current Estimated Value
Purchase Details
Closed on
Jan 8, 2009
Sold by
Choboian Mitchell
Bought by
Choboian Manya Evon and The Manya Choboian Trust
Purchase Details
Closed on
Jan 23, 2007
Sold by
Choboian Mitch
Bought by
Choboian Mitchell and Choboian Manya
Home Financials for this Owner
Home Financials are based on the most recent Mortgage that was taken out on this home.
Original Mortgage
$136,000
Interest Rate
6.17%
Mortgage Type
Purchase Money Mortgage
Purchase Details
Closed on
Dec 29, 2006
Sold by
Ficht Mildred
Bought by
Choboian Mitch and Choboian Manya
Home Financials for this Owner
Home Financials are based on the most recent Mortgage that was taken out on this home.
Original Mortgage
$136,000
Interest Rate
6.17%
Mortgage Type
Purchase Money Mortgage
Purchase Details
Closed on
May 14, 1996
Sold by
Woods Larry Wendell
Bought by
Ficht Mildred
Create a Home Valuation Report for This Property
The Home Valuation Report is an in-depth analysis detailing your home's value as well as a comparison with similar homes in the area
Home Values in the Area
Average Home Value in this Area
Purchase History
| Date | Buyer | Sale Price | Title Company |
|---|---|---|---|
| Lorenzo Kimberly Valov | $140,000 | Chicago Title Company | |
| Choboian Manya Evon | -- | None Available | |
| Choboian Mitchell | -- | None Available | |
| Choboian Mitch | $170,000 | Fidelity Natl Title Co Of Ca | |
| Ficht Mildred | $72,000 | Chicago Title Co |
Source: Public Records
Mortgage History
| Date | Status | Borrower | Loan Amount |
|---|---|---|---|
| Previous Owner | Choboian Mitch | $136,000 |
Source: Public Records
Tax History Compared to Growth
Tax History
| Year | Tax Paid | Tax Assessment Tax Assessment Total Assessment is a certain percentage of the fair market value that is determined by local assessors to be the total taxable value of land and additions on the property. | Land | Improvement |
|---|---|---|---|---|
| 2025 | $1,649 | $151,538 | $32,472 | $119,066 |
| 2024 | $1,649 | $148,568 | $31,836 | $116,732 |
| 2023 | $1,607 | $145,656 | $31,212 | $114,444 |
| 2022 | $1,561 | $142,800 | $30,600 | $112,200 |
| 2021 | $1,541 | $140,000 | $30,000 | $110,000 |
| 2020 | $2,080 | $184,000 | $46,000 | $138,000 |
| 2019 | $2,045 | $173,000 | $43,000 | $130,000 |
| 2018 | $1,815 | $153,000 | $38,000 | $115,000 |
| 2017 | $1,786 | $149,000 | $37,000 | $112,000 |
| 2016 | $1,602 | $137,000 | $34,000 | $103,000 |
| 2015 | $1,357 | $123,000 | $31,000 | $92,000 |
| 2014 | $1,357 | $116,000 | $29,000 | $87,000 |
Source: Public Records
Map
Nearby Homes
- 1160 N Laspina St
- 1205 Jamestown St
- 1842 Plymouth Ave
- 1222 N Laspina St
- 1687 Kaweah Dr
- 1563 E Glenwood Ave
- 602 N Barranca Ct
- 2012 Diamante Dr
- 717 N Mooney Blvd
- 1282 E Ben Franklin Ave
- 1280 E Richard Smith Ave
- 1699 E Academy Ave
- 1579 Monsecco St
- 2587 Isleworth Ave
- 958 Hampton St Unit 567 Sft
- 958 Hampton St
- 3043 Isleworth Ave Unit 543 Sft
- 3021 Isleworth Ave Unit 542 Sft
- 2986 Isleworth Ave Unit 540 Sft
- 3021 Isleworth Ave
- 1060 Freedom St
- 1765 E Cross Ave
- 1772 E Ben Franklin Ave
- 1772 Ben Franklin Ave
- 1760 E Ben Franklin Ave
- 1757 E Cross Ave
- 1784 Ben Franklin Ave
- 1080 Freedom St
- 1760 Ben Franklin Ave
- 1753 E Cross Ave
- 1761 E Cross Ave
- 1050 Freedom St
- 1733 E Cross Ave
- 1749 E Cross Ave
- 1796 Ben Franklin Ave
- 1090 Freedom St
- 1737 E Cross Ave
- 1748 Ben Franklin Ave
- 1070 Freedom St
- 1741 E Cross Ave