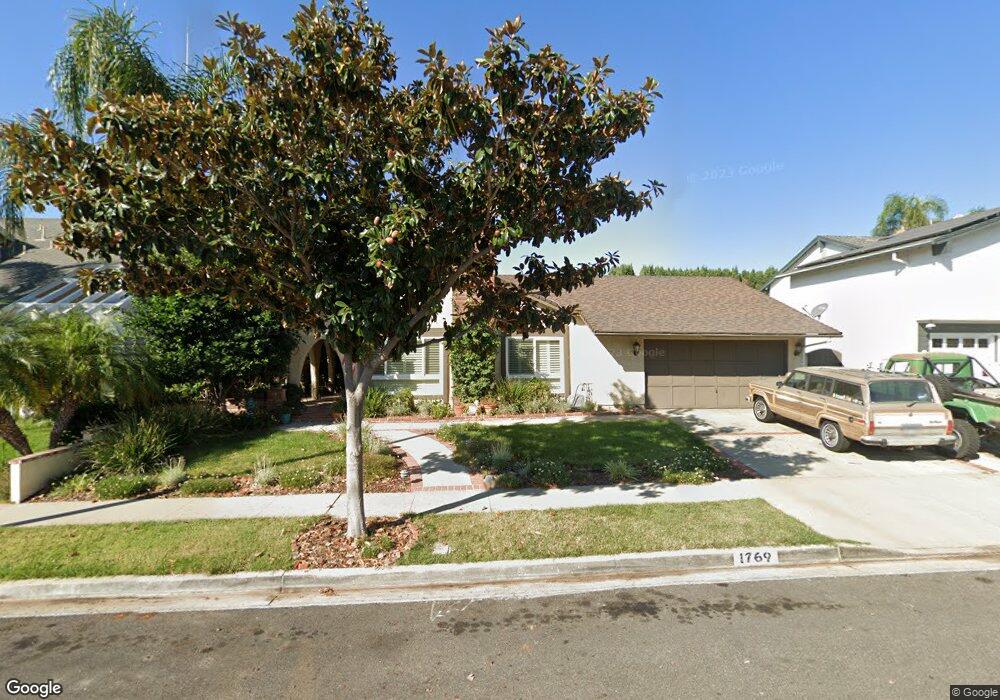
1769 Lee St Simi Valley, CA 93065
Central Simi Valley NeighborhoodEstimated Value: $852,000 - $904,000
4
Beds
2
Baths
1,905
Sq Ft
$460/Sq Ft
Est. Value
About This Home
This home is located at 1769 Lee St, Simi Valley, CA 93065 and is currently estimated at $875,531, approximately $459 per square foot. 1769 Lee St is a home located in Ventura County with nearby schools including Berylwood Elementary School, Hillside Middle School, and Royal High School.
Ownership History
Date
Name
Owned For
Owner Type
Purchase Details
Closed on
Jun 9, 2020
Sold by
Baker Cynthia A and Vopal Baker Cynthia
Bought by
Baker Cynthia A and Cynthia A Baker Trust
Current Estimated Value
Purchase Details
Closed on
Apr 19, 1994
Sold by
Vopal Jack B and Vopal Viola M
Bought by
Vopal Jack B and Vopal Viola M
Home Financials for this Owner
Home Financials are based on the most recent Mortgage that was taken out on this home.
Original Mortgage
$117,000
Interest Rate
7.59%
Purchase Details
Closed on
Apr 14, 1994
Sold by
Baker Karl Vernon
Bought by
Vopal Baker Cynthia A
Home Financials for this Owner
Home Financials are based on the most recent Mortgage that was taken out on this home.
Original Mortgage
$117,000
Interest Rate
7.59%
Create a Home Valuation Report for This Property
The Home Valuation Report is an in-depth analysis detailing your home's value as well as a comparison with similar homes in the area
Home Values in the Area
Average Home Value in this Area
Purchase History
| Date | Buyer | Sale Price | Title Company |
|---|---|---|---|
| Baker Cynthia A | -- | None Available | |
| Vopal Jack B | -- | Commonwealth Land Title Co | |
| Vopal Baker Cynthia A | -- | Commonwealth Land Title Co |
Source: Public Records
Mortgage History
| Date | Status | Borrower | Loan Amount |
|---|---|---|---|
| Closed | Vopal Jack B | $117,000 |
Source: Public Records
Tax History Compared to Growth
Tax History
| Year | Tax Paid | Tax Assessment Tax Assessment Total Assessment is a certain percentage of the fair market value that is determined by local assessors to be the total taxable value of land and additions on the property. | Land | Improvement |
|---|---|---|---|---|
| 2025 | $5,128 | $410,123 | $164,050 | $246,073 |
| 2024 | $5,128 | $402,082 | $160,833 | $241,249 |
| 2023 | $4,820 | $394,199 | $157,680 | $236,519 |
| 2022 | $4,792 | $386,470 | $154,588 | $231,882 |
| 2021 | $4,749 | $378,893 | $151,557 | $227,336 |
| 2020 | $4,645 | $375,010 | $150,004 | $225,006 |
| 2019 | $4,432 | $367,658 | $147,063 | $220,595 |
| 2018 | $4,388 | $360,450 | $144,180 | $216,270 |
| 2017 | $4,286 | $353,383 | $141,353 | $212,030 |
| 2016 | $4,092 | $346,455 | $138,582 | $207,873 |
| 2015 | $4,001 | $341,252 | $136,501 | $204,751 |
| 2014 | $3,940 | $334,570 | $133,828 | $200,742 |
Source: Public Records
Map
Nearby Homes
- 2368 Heywood St
- 2405 Lee St
- 2241 Burnside St
- 2349 Knollhaven St
- 2149 Madrone St
- 2095 Morley St
- 2163 N Justin Ave
- 2146 N Brower St
- 2266 Lansdale Ct
- 2783 Fallon Cir
- 2149 Clover St
- 1948 Heywood St Unit L
- 2730 Niles St
- 2327 Royal Ave
- 1932 Heywood St Unit B
- 2332 N Justin Ave
- 2346 Royal Ave Unit 9
- 2466 Royal Ave
- 2357 Lawnview Ct
- 2886 Galena Ave