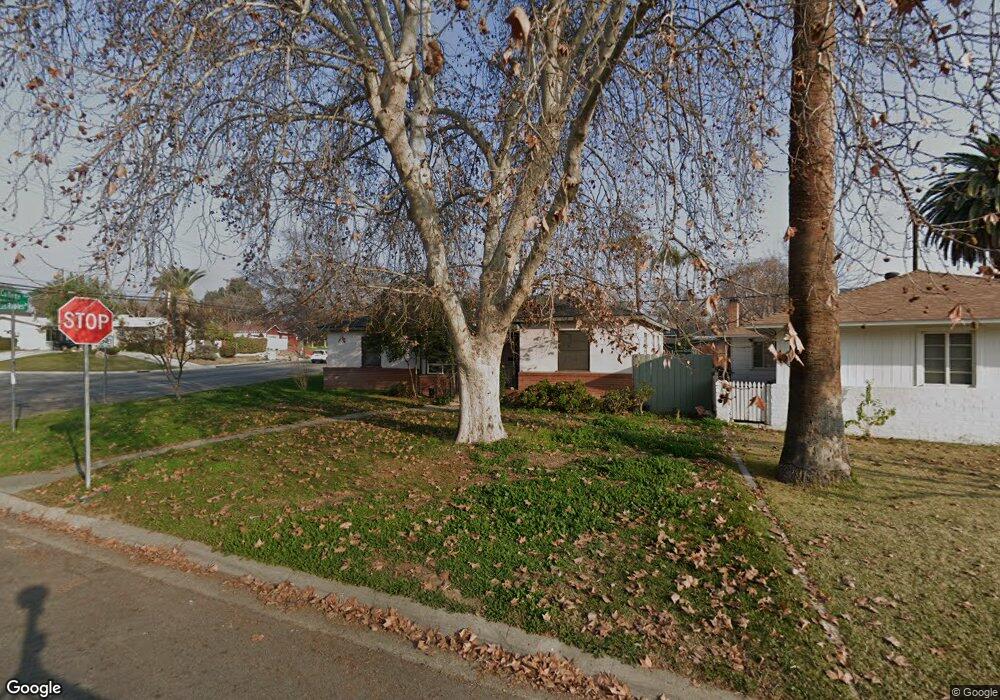
1769 Los Robles Dr Bakersfield, CA 93306
Estimated Value: $295,000 - $330,000
3
Beds
2
Baths
1,385
Sq Ft
$224/Sq Ft
Est. Value
About This Home
This home is located at 1769 Los Robles Dr, Bakersfield, CA 93306 and is currently estimated at $309,960, approximately $223 per square foot. 1769 Los Robles Dr is a home located in Kern County with nearby schools including Horace Mann Elementary School, Emerson Middle School, and East Bakersfield High School.
Ownership History
Date
Name
Owned For
Owner Type
Purchase Details
Closed on
Jan 20, 2012
Sold by
Graviss Charles P
Bought by
Prouty Kimberly A
Current Estimated Value
Purchase Details
Closed on
Nov 5, 2008
Sold by
Graviss Charles
Bought by
Graviss Charles P and Charles P Graviss Revocable Tr
Purchase Details
Closed on
Jul 15, 2004
Sold by
Ferreira Kimberly
Bought by
Graviss Charles and Graviss Betty
Purchase Details
Closed on
Aug 23, 1999
Sold by
Hud
Bought by
Ferreira Kimberly and Graviss Charles
Home Financials for this Owner
Home Financials are based on the most recent Mortgage that was taken out on this home.
Original Mortgage
$67,420
Interest Rate
7.56%
Mortgage Type
FHA
Purchase Details
Closed on
Oct 15, 1998
Sold by
Ge Capital Mtg Services Inc
Bought by
Hud
Purchase Details
Closed on
Oct 12, 1998
Sold by
Welcher John O and Welcher Elizabeth A
Bought by
Ge Capital Mtg Services Inc
Create a Home Valuation Report for This Property
The Home Valuation Report is an in-depth analysis detailing your home's value as well as a comparison with similar homes in the area
Home Values in the Area
Average Home Value in this Area
Purchase History
| Date | Buyer | Sale Price | Title Company |
|---|---|---|---|
| Prouty Kimberly A | -- | None Available | |
| Graviss Charles P | -- | None Available | |
| Graviss Charles P | -- | None Available | |
| Graviss Charles | -- | Alliance Title | |
| Ferreira Kimberly | $66,500 | American Title Co | |
| Hud | -- | Benefit Land Title Ins Compa | |
| Ge Capital Mtg Services Inc | $96,106 | Benefit Land Title Insurance |
Source: Public Records
Mortgage History
| Date | Status | Borrower | Loan Amount |
|---|---|---|---|
| Previous Owner | Ferreira Kimberly | $67,420 |
Source: Public Records
Tax History
| Year | Tax Paid | Tax Assessment Tax Assessment Total Assessment is a certain percentage of the fair market value that is determined by local assessors to be the total taxable value of land and additions on the property. | Land | Improvement |
|---|---|---|---|---|
| 2025 | $2,054 | $102,982 | $31,394 | $71,588 |
| 2024 | $1,990 | $100,964 | $30,779 | $70,185 |
| 2023 | $1,990 | $98,985 | $30,176 | $68,809 |
| 2022 | $1,900 | $97,045 | $29,585 | $67,460 |
| 2021 | $1,801 | $95,143 | $29,005 | $66,138 |
| 2020 | $1,763 | $94,168 | $28,708 | $65,460 |
| 2019 | $1,703 | $94,168 | $28,708 | $65,460 |
| 2018 | $1,656 | $90,514 | $27,595 | $62,919 |
| 2017 | $1,636 | $88,740 | $27,054 | $61,686 |
| 2016 | $1,420 | $87,001 | $26,524 | $60,477 |
| 2015 | $1,415 | $85,695 | $26,126 | $59,569 |
| 2014 | $1,362 | $84,018 | $25,615 | $58,403 |
Source: Public Records
Map
Nearby Homes
- 1801 Los Robles Dr
- 1717 Locust Ravine
- 1805 Morgan Ln
- 2609 Edwards Ave
- 2613 Edwards Ave
- 1704 Camino Primavera
- 2417 Edwards Ave
- 2712 Primera Vista
- 2708 College Ave
- 2720 Edwards Ave
- 2525 Avenida Escuela
- 1717 Camino Sierra
- 2814 College Ave
- 2239 Elton Ave
- 1800 Country Club Dr
- 2100 Kent Dr
- 1812 Country Club Dr
- 2935 Shelly Ln
- 1904 Ridgewood Dr
- 1733 Crestmont Dr
- 1765 Los Robles Dr
- 1772 Locust Ravine
- 1761 Los Robles Dr
- 1800 Los Robles Dr
- 1760 Locust Ravine
- 1804 Los Robles Dr
- 1756 Los Robles Dr
- 1805 Los Robles Dr
- 1757 Los Robles Dr
- 1800 Locust Ravine
- 1801 Shirlee Ct
- 1750 Locust Ravine
- 1808 Los Robles Dr
- 1809 Los Robles Dr
- 1769 Locust Ravine
- 1805 Shirlee Ct
- 1804 Locust Ravine
- 1751 Los Robles Dr
- 1812 Los Robles Dr
- 1813 Los Robles Dr
Your Personal Tour Guide
Ask me questions while you tour the home.