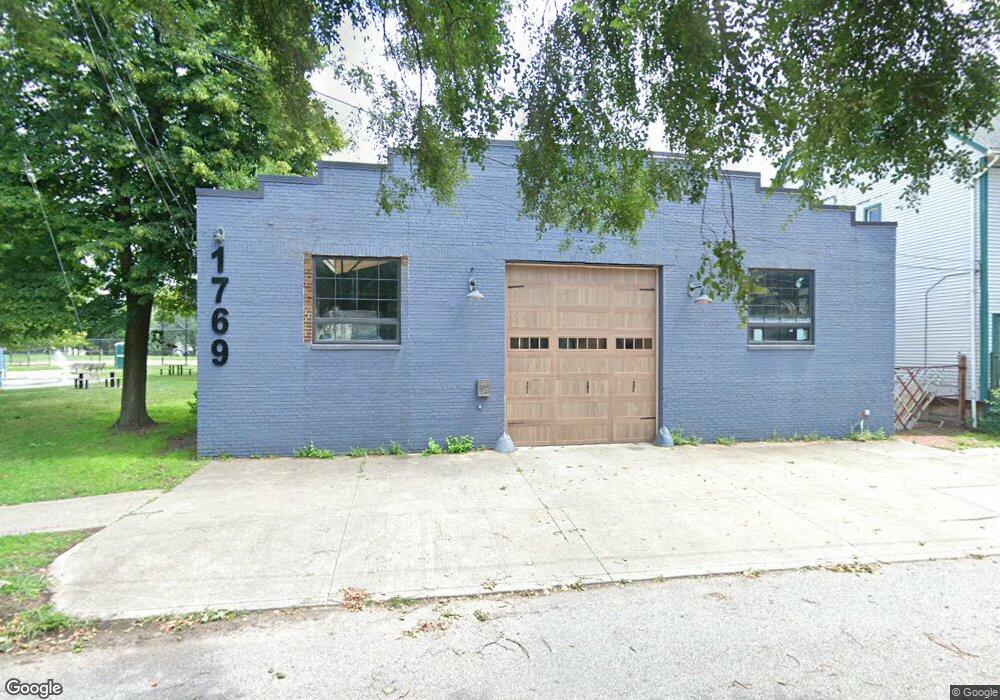
1769 W 38th St Cleveland, OH 44113
Ohio City NeighborhoodEstimated Value: $306,102
--
Bed
--
Bath
8,370
Sq Ft
$37/Sq Ft
Est. Value
About This Home
This home is located at 1769 W 38th St, Cleveland, OH 44113 and is currently estimated at $306,102, approximately $36 per square foot. 1769 W 38th St is a home located in Cuyahoga County with nearby schools including Almira Academy, Anton Grdina School, and Benjamin Franklin.
Ownership History
Date
Name
Owned For
Owner Type
Purchase Details
Closed on
Nov 15, 2024
Sold by
13010 Larchmere Llc
Bought by
Perrenoud Yehu
Current Estimated Value
Purchase Details
Closed on
Nov 7, 2024
Sold by
Perrenoud Yehuda
Bought by
1934 North Avenue Llc
Purchase Details
Closed on
May 17, 2016
Sold by
Harrah Mark A
Bought by
13010 Larchmere Llc
Purchase Details
Closed on
Nov 30, 2009
Sold by
Harrah Theodore E and Harrah Patricia E
Bought by
Harrah Mark A
Purchase Details
Closed on
Jan 13, 1998
Sold by
Best Roofing & Painting Inc
Bought by
Harrah Theodore E and Harrah Patricia E
Purchase Details
Closed on
Oct 11, 1989
Sold by
Calicchia Stone
Bought by
Best Roofing and Best Painting,
Purchase Details
Closed on
Mar 20, 1985
Bought by
Calicchia Stone
Purchase Details
Closed on
Jan 24, 1984
Bought by
Calicchia & Stilson Inc
Purchase Details
Closed on
Jan 1, 1975
Bought by
Triple-D Inc
Create a Home Valuation Report for This Property
The Home Valuation Report is an in-depth analysis detailing your home's value as well as a comparison with similar homes in the area
Home Values in the Area
Average Home Value in this Area
Purchase History
| Date | Buyer | Sale Price | Title Company |
|---|---|---|---|
| Perrenoud Yehu | -- | None Listed On Document | |
| Perrenoud Yehu | -- | None Listed On Document | |
| 1934 North Avenue Llc | $285,000 | None Listed On Document | |
| 1934 North Avenue Llc | $285,000 | None Listed On Document | |
| 13010 Larchmere Llc | $168,000 | Titleblu | |
| Harrah Mark A | -- | Attorney | |
| Harrah Theodore E | -- | -- | |
| Best Roofing | $20,000 | -- | |
| Calicchia Stone | $39,400 | -- | |
| Calicchia & Stilson Inc | $38,000 | -- | |
| Triple-D Inc | -- | -- |
Source: Public Records
Tax History Compared to Growth
Tax History
| Year | Tax Paid | Tax Assessment Tax Assessment Total Assessment is a certain percentage of the fair market value that is determined by local assessors to be the total taxable value of land and additions on the property. | Land | Improvement |
|---|---|---|---|---|
| 2024 | $7,391 | $71,610 | $23,520 | $48,090 |
| 2023 | $6,124 | $61,320 | $12,320 | $49,000 |
| 2022 | $6,116 | $61,320 | $12,320 | $49,000 |
| 2021 | $6,134 | $61,320 | $12,320 | $49,000 |
| 2020 | $5,797 | $55,760 | $11,200 | $44,560 |
| 2019 | $5,457 | $159,300 | $32,000 | $127,300 |
| 2018 | $2,661 | $55,760 | $11,200 | $44,560 |
| 2017 | $8,419 | $58,800 | $6,160 | $52,640 |
| 2016 | $3,528 | $34,720 | $6,160 | $28,560 |
| 2015 | $16,227 | $34,720 | $6,160 | $28,560 |
| 2014 | $11,094 | $31,570 | $5,600 | $25,970 |
Source: Public Records
Map
Nearby Homes
- 3823 John Ave
- 3141 Whitman Ave
- 1730 Randall Rd
- 1786 Randall Rd
- 3897 Clinton Ave
- 1522 W 32nd St
- 4213 Clinton Ave
- 4208 Whitman Ave
- 4211 Clinton Ave
- 3118 Vine Ct
- 3014 Franklin Blvd
- 4208 Bridge Ave
- 1960 Randall Rd
- 1858 W 45th St
- 1827 W 47th St Unit S/L 5
- 1831 W 47th St Unit SL2
- 2817 Jay Ave
- 4706 Franklin Blvd
- 2815 Bridge Ave
- 2074 W 33rd St
- 3604 Woodbine Ave
- 3700 Woodbine Ave
- 3508 Woodbine Ave
- 3500 Woodbine Ave
- 3800 Woodbine Ave
- 3410 Woodbine Ave
- 1750 W 38th St
- 3701 Woodbine Ave
- 1748 W 38th St
- 3406 Woodbine Ave
- 3810 Woodbine Ave
- 3402 Woodbine Ave
- 1740 W 38th St
- 3505 Woodbine Ave
- 3812 Woodbine Ave
- 3501 Woodbine Ave
- 1808 W 38th St
- 1827 W 38th St
- 3304 Woodbine Ave
- 3407 Woodbine Ave