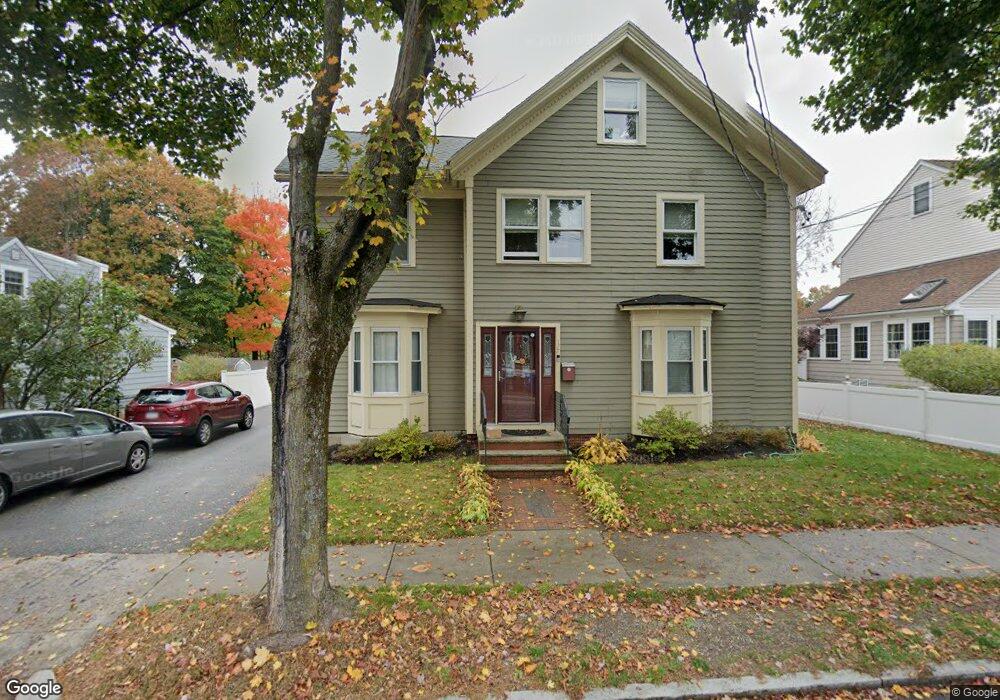
177 Broadway St Wakefield, MA 01880
West Side NeighborhoodEstimated Value: $716,000 - $977,000
4
Beds
2
Baths
2,665
Sq Ft
$329/Sq Ft
Est. Value
About This Home
This home is located at 177 Broadway St, Wakefield, MA 01880 and is currently estimated at $876,142, approximately $328 per square foot. 177 Broadway St is a home located in Middlesex County with nearby schools including Wakefield Memorial High School, St Joseph School, and St. Patrick Elementary School.
Ownership History
Date
Name
Owned For
Owner Type
Purchase Details
Closed on
Dec 2, 2002
Sold by
Lorenzo Brenda and Lorenzo Michael
Bought by
Cresta Joseph and Cresta Victoria
Current Estimated Value
Home Financials for this Owner
Home Financials are based on the most recent Mortgage that was taken out on this home.
Original Mortgage
$294,500
Outstanding Balance
$125,773
Interest Rate
6.16%
Mortgage Type
Purchase Money Mortgage
Estimated Equity
$750,369
Create a Home Valuation Report for This Property
The Home Valuation Report is an in-depth analysis detailing your home's value as well as a comparison with similar homes in the area
Home Values in the Area
Average Home Value in this Area
Purchase History
| Date | Buyer | Sale Price | Title Company |
|---|---|---|---|
| Cresta Joseph | $310,000 | -- |
Source: Public Records
Mortgage History
| Date | Status | Borrower | Loan Amount |
|---|---|---|---|
| Open | Cresta Joseph | $294,500 |
Source: Public Records
Tax History Compared to Growth
Tax History
| Year | Tax Paid | Tax Assessment Tax Assessment Total Assessment is a certain percentage of the fair market value that is determined by local assessors to be the total taxable value of land and additions on the property. | Land | Improvement |
|---|---|---|---|---|
| 2025 | $9,432 | $831,000 | $395,600 | $435,400 |
| 2024 | $9,295 | $826,200 | $393,300 | $432,900 |
| 2023 | $8,839 | $753,500 | $358,700 | $394,800 |
| 2022 | $8,454 | $686,200 | $326,700 | $359,500 |
| 2021 | $7,980 | $626,900 | $304,500 | $322,400 |
| 2020 | $7,484 | $586,100 | $284,700 | $301,400 |
| 2019 | $7,150 | $557,300 | $270,700 | $286,600 |
| 2018 | $6,656 | $514,000 | $249,700 | $264,300 |
| 2017 | $6,258 | $480,300 | $233,300 | $247,000 |
| 2016 | $5,879 | $435,800 | $220,800 | $215,000 |
| 2015 | $5,489 | $407,200 | $206,300 | $200,900 |
| 2014 | $5,003 | $391,500 | $198,300 | $193,200 |
Source: Public Records
Map
Nearby Homes
- 5 Byron St
- 69 Foundry St Unit 416
- 69 Foundry St Unit 310
- 10 Converse St
- 62 Foundry St Unit 310
- 62 Foundry St Unit 312
- 62 Foundry St Unit 506
- 62 Foundry St Unit 202
- 62 Foundry St Unit 208
- 62 Foundry St Unit 414
- 62 Foundry St Unit 406
- 62 Foundry St Unit 313
- Unit 208 Plan at Wrenly
- Unit 310 Plan at Wrenly
- 6 Avon Ct Unit 2
- 34 Cedar St
- 4 Vernon Ave
- 50 Albion St
- 47 Emerson St
- 4 Adams St
- 179 Broadway St
- 175 Broadway St
- 173 Broadway St
- 40 Bartley St
- 40 Bartley St Unit 2
- 182 Broadway St
- 182 Broadway St Unit 2
- 38 Bartley St
- 42 Bartley St
- 180 Broadway St
- 180 Broadway St Unit 2
- 180 Broadway St Unit 1
- 171 Broadway St
- 185 Broadway St
- 44 Bartley St
- 44 Bartley St Unit 1
- 36 Bartley St
- 184 Broadway St Unit 3
- 184 Broadway St
- 178 Broadway St Unit 1