Estimated Value: $61,000 - $138,000
3
Beds
1
Bath
1,164
Sq Ft
$84/Sq Ft
Est. Value
About This Home
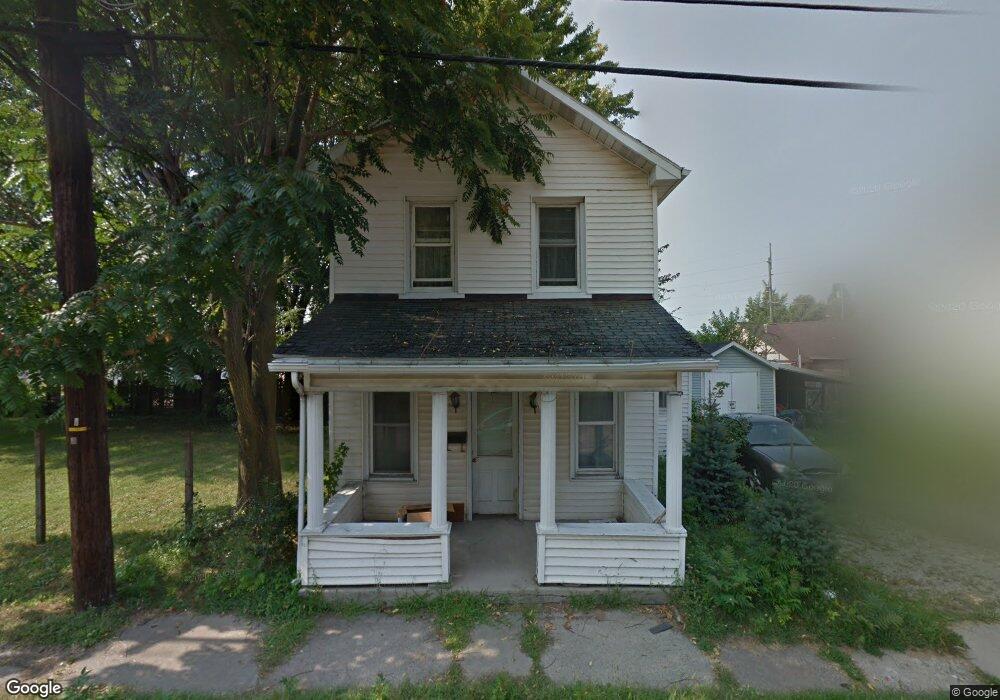
This home is located at 177 E Maple St, Clyde, OH 43410 and is currently estimated at $98,247, approximately $84 per square foot. 177 E Maple St is a home located in Sandusky County with nearby schools including Clyde High School, St Mary's Catholic School, and Harvest Temple Christian Academy.
Ownership History
Date
Name
Owned For
Owner Type
Purchase Details
Closed on
Jul 21, 2004
Sold by
Barnard Marvin E and Barnard Maria D
Bought by
Howard David W
Current Estimated Value
Home Financials for this Owner
Home Financials are based on the most recent Mortgage that was taken out on this home.
Original Mortgage
$44,000
Outstanding Balance
$21,364
Interest Rate
6.34%
Mortgage Type
Purchase Money Mortgage
Estimated Equity
$76,883
Purchase Details
Closed on
Apr 8, 2002
Sold by
Blanton Corbet
Bought by
Barnard Marvin E
Home Financials for this Owner
Home Financials are based on the most recent Mortgage that was taken out on this home.
Original Mortgage
$47,000
Interest Rate
6.87%
Mortgage Type
New Conventional
Purchase Details
Closed on
Aug 2, 2001
Sold by
Linder Donald
Bought by
Blanton Corbert and Blanton Leo
Purchase Details
Closed on
Jan 1, 1990
Bought by
Howard David W
Create a Home Valuation Report for This Property
The Home Valuation Report is an in-depth analysis detailing your home's value as well as a comparison with similar homes in the area
Home Values in the Area
Average Home Value in this Area
Purchase History
| Date | Buyer | Sale Price | Title Company |
|---|---|---|---|
| Howard David W | $41,250 | Midland Title | |
| Barnard Marvin E | $46,000 | -- | |
| Blanton Corbert | $35,000 | -- | |
| Howard David W | $18,000 | -- |
Source: Public Records
Mortgage History
| Date | Status | Borrower | Loan Amount |
|---|---|---|---|
| Open | Howard David W | $44,000 | |
| Previous Owner | Barnard Marvin E | $47,000 |
Source: Public Records
Tax History
| Year | Tax Paid | Tax Assessment Tax Assessment Total Assessment is a certain percentage of the fair market value that is determined by local assessors to be the total taxable value of land and additions on the property. | Land | Improvement |
|---|---|---|---|---|
| 2025 | $844 | $62,900 | $5,600 | $57,300 |
| 2024 | $844 | $22,020 | $1,960 | $20,060 |
| 2023 | $826 | $17,610 | $1,580 | $16,030 |
| 2022 | $839 | $17,610 | $1,580 | $16,030 |
| 2021 | $727 | $17,610 | $1,580 | $16,030 |
| 2020 | $675 | $16,250 | $1,580 | $14,670 |
| 2019 | $667 | $16,250 | $1,580 | $14,670 |
| 2018 | $667 | $16,250 | $1,580 | $14,670 |
| 2017 | $629 | $14,920 | $1,580 | $13,340 |
| 2016 | $721 | $14,920 | $1,580 | $13,340 |
| 2015 | $612 | $14,920 | $1,580 | $13,340 |
| 2014 | $637 | $14,810 | $1,540 | $13,270 |
| 2013 | $621 | $14,810 | $1,540 | $13,270 |
Source: Public Records
Map
Nearby Homes
- 0 W Mcpherson Hwy
- 1337 E Sr 20
- 1337 U S 20
- 246 Spring St
- 135 Mechanic St
- 209 Fair St
- 761 N Woodland Ave
- 119 Warnecke Dr
- 891 N Woodland Ave
- 0 Durnwald Dr
- CR 260 89.6 acres Durnwald Dr
- 1270 W Mcpherson Hwy
- 119 Woodhaven Crescent
- 3446 County Road 213
- 0 County Road 175
- 101 Nathan Dr
- 1727 E Mcpherson Hwy
- 2690 County Road 213
- 3850 County Road 231
- 5255 County Road 177
- 181 E Maple St
- 169 E Maple St
- 214 E Mcpherson Hwy
- 187 E Maple St
- 189 E Maple St
- 163 E Maple St
- 170 E Maple St
- 178 E Maple St
- 166 E Maple St
- 2314 State Route 20
- 158 E Maple St
- 7084 Ohio 101
- 2012 Ohio 101
- 2168 Ohio 101
- 2114 Ohio 101
- 2074 Ohio 101
- 1560 Ohio 101
- 7475 Ohio 101
- 101 Ohio 101
- 219 E Mcpherson Hwy
Your Personal Tour Guide
Ask me questions while you tour the home.