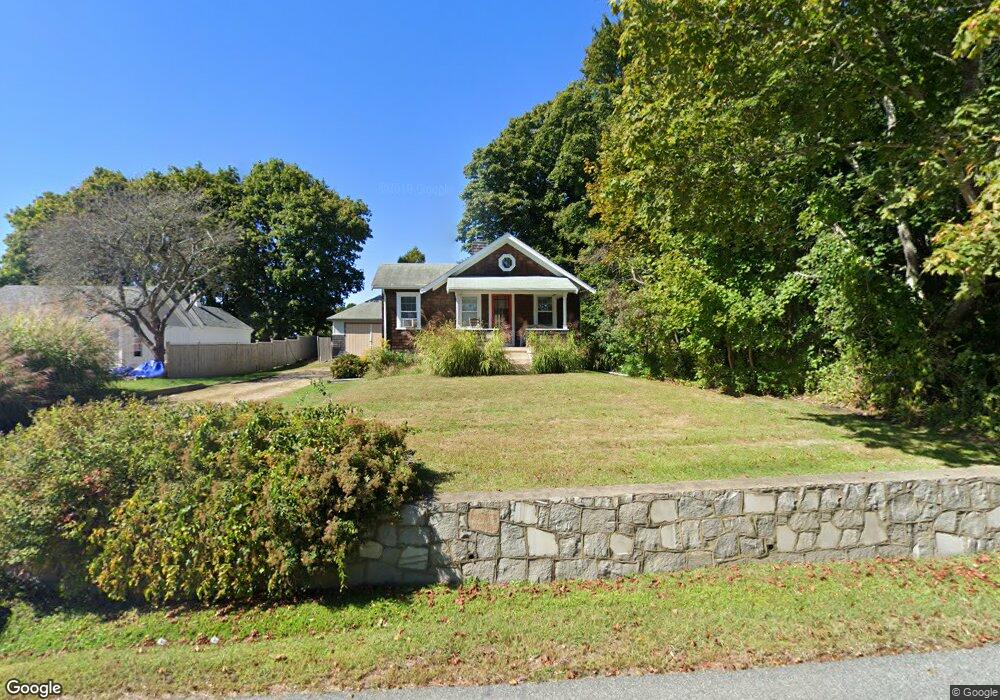
177 E Shore Rd Jamestown, RI 02835
East Shore Road NeighborhoodEstimated Value: $550,000 - $1,027,000
2
Beds
1
Bath
577
Sq Ft
$1,336/Sq Ft
Est. Value
About This Home
This home is located at 177 E Shore Rd, Jamestown, RI 02835 and is currently estimated at $770,758, approximately $1,335 per square foot. 177 E Shore Rd is a home located in Newport County with nearby schools including Melrose Avenue School and Lawn Avenue School.
Ownership History
Date
Name
Owned For
Owner Type
Purchase Details
Closed on
Nov 27, 2000
Sold by
Graham E W Sterling
Bought by
Casey Martin J
Current Estimated Value
Home Financials for this Owner
Home Financials are based on the most recent Mortgage that was taken out on this home.
Original Mortgage
$132,800
Interest Rate
7.78%
Mortgage Type
Purchase Money Mortgage
Create a Home Valuation Report for This Property
The Home Valuation Report is an in-depth analysis detailing your home's value as well as a comparison with similar homes in the area
Home Values in the Area
Average Home Value in this Area
Purchase History
| Date | Buyer | Sale Price | Title Company |
|---|---|---|---|
| Casey Martin J | $148,000 | -- |
Source: Public Records
Mortgage History
| Date | Status | Borrower | Loan Amount |
|---|---|---|---|
| Closed | Casey Martin J | $98,000 | |
| Closed | Casey Martin J | $135,000 | |
| Closed | Casey Martin J | $132,800 |
Source: Public Records
Tax History
| Year | Tax Paid | Tax Assessment Tax Assessment Total Assessment is a certain percentage of the fair market value that is determined by local assessors to be the total taxable value of land and additions on the property. | Land | Improvement |
|---|---|---|---|---|
| 2025 | $2,482 | $440,000 | $276,300 | $163,700 |
| 2024 | $2,400 | $334,700 | $209,300 | $125,400 |
| 2023 | $2,336 | $334,700 | $209,300 | $125,400 |
| 2022 | $2,074 | $305,400 | $209,300 | $96,100 |
| 2021 | $1,695 | $204,700 | $100,800 | $103,900 |
| 2020 | $1,652 | $204,700 | $100,800 | $103,900 |
| 2019 | $1,648 | $204,700 | $100,800 | $103,900 |
| 2018 | $1,546 | $174,700 | $95,000 | $79,700 |
| 2017 | $1,513 | $174,700 | $95,000 | $79,700 |
| 2016 | $1,499 | $174,700 | $95,000 | $79,700 |
| 2015 | $1,463 | $166,600 | $116,600 | $50,000 |
| 2014 | $1,458 | $166,600 | $116,600 | $50,000 |
Source: Public Records
Map
Nearby Homes
- 10 Coulter St
- 174 Seaside Dr
- 31 Buloid Ave
- 121 Seaside Dr
- 63 Longfellow Rd
- 127 Longfellow Rd
- 63 Pemberton Ave
- 46 North Rd
- 73 Conanicus Ave Unit 4
- 48 Ocean Ave
- 78 Narragansett Ave
- 77 Narragansett Ave Unit C
- 14 Clinton Ave
- 30 W Bay View Dr
- 24 Southwest Ave
- 22 Southwest Ave
- 22 Cole St
- 0 Walcott Ave
- 777 E Shore Rd
- 30 Walcott Ave
Your Personal Tour Guide
Ask me questions while you tour the home.