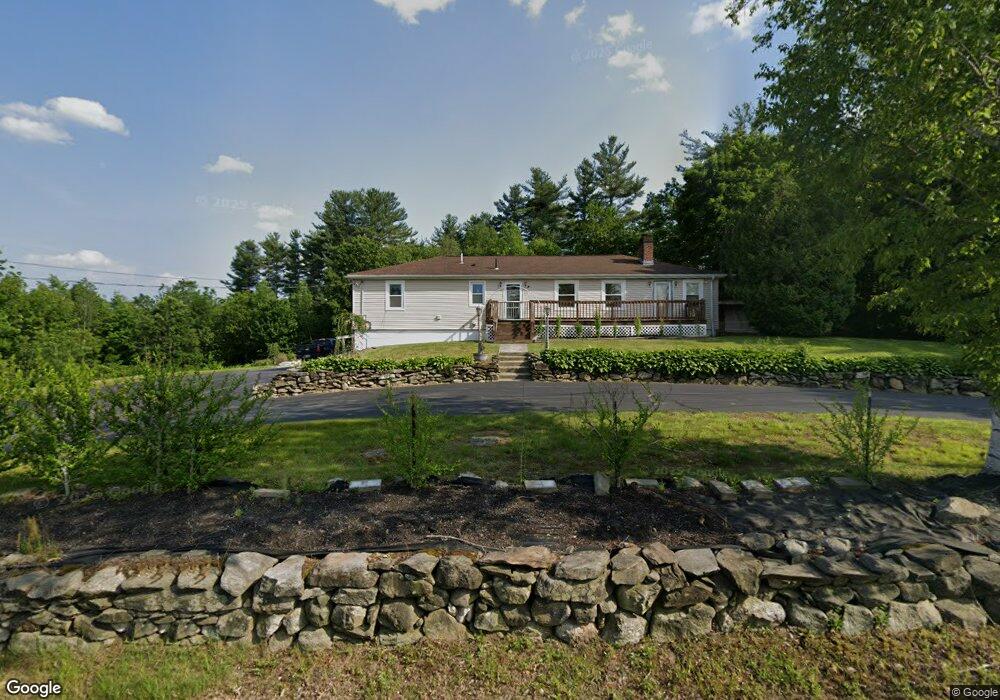
177 Marsh Rd Pelham, NH 03076
Estimated Value: $556,000 - $624,914
4
Beds
2
Baths
1,900
Sq Ft
$311/Sq Ft
Est. Value
About This Home
This home is located at 177 Marsh Rd, Pelham, NH 03076 and is currently estimated at $591,479, approximately $311 per square foot. 177 Marsh Rd is a home located in Hillsborough County with nearby schools including Pelham Elementary School, Pelham Memorial School, and Pelham High School.
Ownership History
Date
Name
Owned For
Owner Type
Purchase Details
Closed on
Aug 14, 2008
Sold by
Allen Harold
Bought by
Garozzo Orazio A
Current Estimated Value
Home Financials for this Owner
Home Financials are based on the most recent Mortgage that was taken out on this home.
Original Mortgage
$197,010
Interest Rate
6.4%
Mortgage Type
Purchase Money Mortgage
Purchase Details
Closed on
Dec 1, 2000
Sold by
Chodakowski Simonne J and Chodakowski Andree
Bought by
Sally Brenda
Create a Home Valuation Report for This Property
The Home Valuation Report is an in-depth analysis detailing your home's value as well as a comparison with similar homes in the area
Home Values in the Area
Average Home Value in this Area
Purchase History
| Date | Buyer | Sale Price | Title Company |
|---|---|---|---|
| Garozzo Orazio A | $219,000 | -- | |
| Sally Brenda | $195,000 | -- |
Source: Public Records
Mortgage History
| Date | Status | Borrower | Loan Amount |
|---|---|---|---|
| Open | Sally Brenda | $50,000 | |
| Open | Sally Brenda | $206,400 | |
| Closed | Sally Brenda | $197,010 | |
| Previous Owner | Sally Brenda | $276,000 |
Source: Public Records
Tax History
| Year | Tax Paid | Tax Assessment Tax Assessment Total Assessment is a certain percentage of the fair market value that is determined by local assessors to be the total taxable value of land and additions on the property. | Land | Improvement |
|---|---|---|---|---|
| 2024 | $8,882 | $484,300 | $140,600 | $343,700 |
| 2023 | $8,768 | $482,000 | $140,600 | $341,400 |
| 2022 | $8,396 | $482,000 | $140,600 | $341,400 |
| 2021 | $7,693 | $482,000 | $140,600 | $341,400 |
| 2020 | $6,684 | $330,900 | $112,400 | $218,500 |
| 2019 | $6,171 | $318,100 | $112,400 | $205,700 |
| 2018 | $6,348 | $295,800 | $112,400 | $183,400 |
| 2017 | $6,345 | $295,800 | $112,400 | $183,400 |
| 2016 | $6,197 | $295,800 | $112,400 | $183,400 |
| 2015 | $5,543 | $238,300 | $106,800 | $131,500 |
| 2014 | $5,450 | $238,300 | $106,800 | $131,500 |
| 2013 | $5,461 | $238,800 | $106,800 | $132,000 |
Source: Public Records
Map
Nearby Homes
- 6 Wilshire Ln Unit 6
- 4 Wilshire Ln Unit 4
- 4 Wilshire Ln
- 9 Cornstalk Ln
- 40 Westfall Rd
- 6 David Dr
- 43 & 53 5th St
- 2 Aspen Dr
- 2 Aspen Dr Unit Lot 146-17
- 10 Oakland Ridge Rd Unit 11
- 17 Spare St
- 1905 Lakeview Ave
- 60 Robert St
- 29 Mill St Unit B
- 53 Vinal St
- 26 Sagewood Dr Unit 26
- 154 New Boston Rd
- 83 Turgeon Ave
- 13 Dallas Dr Unit 305
- 13 Dallas Dr Unit 107
Your Personal Tour Guide
Ask me questions while you tour the home.