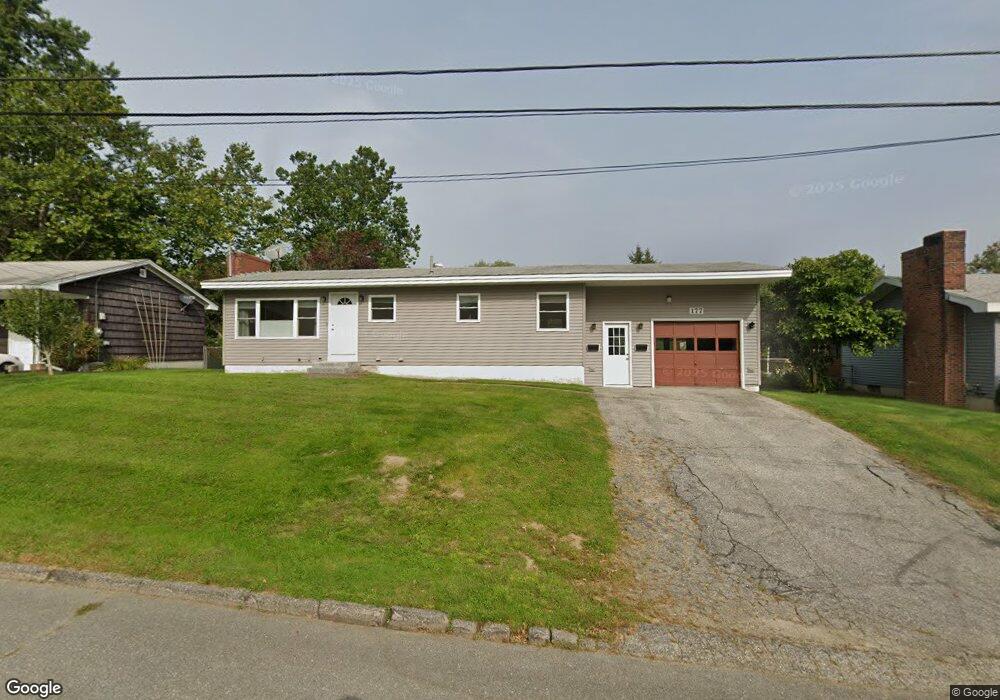
177 Myrtle St Westbrook, ME 04092
Estimated Value: $467,176 - $632,000
2
Beds
1
Bath
1,540
Sq Ft
$342/Sq Ft
Est. Value
About This Home
This home is located at 177 Myrtle St, Westbrook, ME 04092 and is currently estimated at $526,294, approximately $341 per square foot. 177 Myrtle St is a home located in Cumberland County with nearby schools including Westbrook High School, Breakwater School, and The Little Dolphin School Foundation.
Ownership History
Date
Name
Owned For
Owner Type
Purchase Details
Closed on
Nov 23, 2009
Sold by
Solomon Jason D
Bought by
Fitzgerald Chris J
Current Estimated Value
Home Financials for this Owner
Home Financials are based on the most recent Mortgage that was taken out on this home.
Original Mortgage
$182,631
Outstanding Balance
$118,394
Interest Rate
4.86%
Mortgage Type
FHA
Estimated Equity
$407,900
Purchase Details
Closed on
Jun 21, 2005
Sold by
Foley Richard A and Leighton Vicotria
Bought by
Solomon Jason D and Reed Alisa M
Home Financials for this Owner
Home Financials are based on the most recent Mortgage that was taken out on this home.
Original Mortgage
$158,000
Interest Rate
5.78%
Mortgage Type
Purchase Money Mortgage
Create a Home Valuation Report for This Property
The Home Valuation Report is an in-depth analysis detailing your home's value as well as a comparison with similar homes in the area
Home Values in the Area
Average Home Value in this Area
Purchase History
| Date | Buyer | Sale Price | Title Company |
|---|---|---|---|
| Fitzgerald Chris J | $15,000 | -- | |
| Solomon Jason D | -- | -- |
Source: Public Records
Mortgage History
| Date | Status | Borrower | Loan Amount |
|---|---|---|---|
| Open | Fitzgerald Chris J | $182,631 | |
| Previous Owner | Solomon Jason D | $158,000 |
Source: Public Records
Tax History Compared to Growth
Tax History
| Year | Tax Paid | Tax Assessment Tax Assessment Total Assessment is a certain percentage of the fair market value that is determined by local assessors to be the total taxable value of land and additions on the property. | Land | Improvement |
|---|---|---|---|---|
| 2023 | $4,534 | $271,800 | $86,800 | $185,000 |
| 2022 | $4,109 | $227,000 | $72,300 | $154,700 |
| 2021 | $4,047 | $227,000 | $72,300 | $154,700 |
| 2020 | $4,054 | $227,000 | $72,300 | $154,700 |
| 2019 | $4,054 | $227,000 | $72,300 | $154,700 |
| 2018 | $3,539 | $177,400 | $62,800 | $114,600 |
| 2017 | $3,349 | $177,400 | $62,800 | $114,600 |
| 2016 | $3,264 | $177,400 | $62,800 | $114,600 |
| 2015 | $3,186 | $177,400 | $62,800 | $114,600 |
| 2014 | $3,051 | $177,400 | $62,800 | $114,600 |
| 2013 | $3,051 | $177,400 | $62,800 | $114,600 |
Source: Public Records
Map
Nearby Homes
- 154 Myrtle St
- 110 Myrtle St
- 42 Lowell St
- 48 Nasson Ave
- 159 Lincoln St Unit 15
- 18 Cole St
- 45 Emery St
- 3 Collins Place Unit 5
- 21 Clover Ln Unit 201
- 21 Clover Ln Unit 103
- 21 Clover Ln Unit 402
- 21 Clover Ln Unit 406
- 21 Clover Ln Unit 309
- 21 Clover Ln Unit 109
- 21 Clover Ln Unit 306
- 21 Clover Ln Unit 107
- 27 Fawn Woods Way Unit 27
- 10 Nicklaus Ln
- 17 Graham Rd Unit 3
- 17 Mechanic St