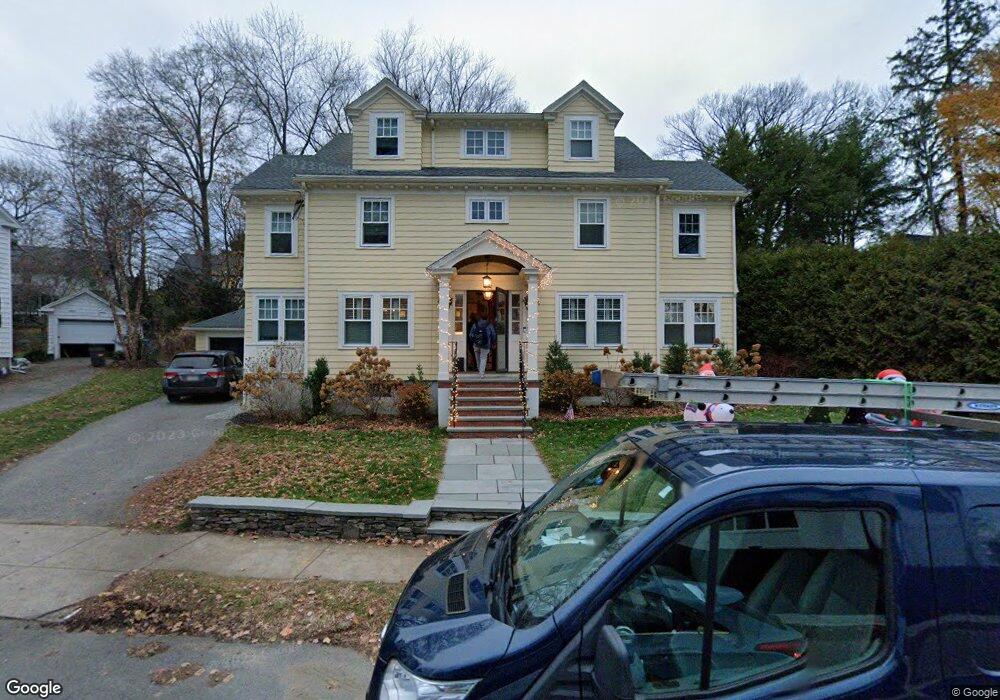
177 Orchard St Belmont, MA 02478
Belmont Center NeighborhoodEstimated Value: $1,447,000 - $1,934,936
4
Beds
2
Baths
1,859
Sq Ft
$946/Sq Ft
Est. Value
About This Home
This home is located at 177 Orchard St, Belmont, MA 02478 and is currently estimated at $1,758,984, approximately $946 per square foot. 177 Orchard St is a home located in Middlesex County with nearby schools including Roger Wellington Elementary School, Winthrop L Chenery Middle School, and Belmont High School.
Ownership History
Date
Name
Owned For
Owner Type
Purchase Details
Closed on
Mar 16, 2021
Sold by
Melanson Beth A
Bought by
Melanson Beth A and Melanson Paul
Current Estimated Value
Purchase Details
Closed on
Jun 13, 2014
Sold by
Mclean Mary E
Bought by
Melanson Beth A
Home Financials for this Owner
Home Financials are based on the most recent Mortgage that was taken out on this home.
Original Mortgage
$450,000
Interest Rate
4.27%
Mortgage Type
New Conventional
Purchase Details
Closed on
Aug 4, 2009
Sold by
Reintjes Ellen E and Tatzin Ellen E
Bought by
Mclean Mary E and Melanson Beth A
Home Financials for this Owner
Home Financials are based on the most recent Mortgage that was taken out on this home.
Original Mortgage
$479,446
Interest Rate
5.43%
Mortgage Type
Purchase Money Mortgage
Create a Home Valuation Report for This Property
The Home Valuation Report is an in-depth analysis detailing your home's value as well as a comparison with similar homes in the area
Home Values in the Area
Average Home Value in this Area
Purchase History
| Date | Buyer | Sale Price | Title Company |
|---|---|---|---|
| Melanson Beth A | -- | None Available | |
| Melanson Beth A | -- | -- | |
| Mclean Mary E | $589,000 | -- |
Source: Public Records
Mortgage History
| Date | Status | Borrower | Loan Amount |
|---|---|---|---|
| Previous Owner | Melanson Beth A | $450,000 | |
| Previous Owner | Melanson Beth A | $75,000 | |
| Previous Owner | Mclean Mary E | $479,446 |
Source: Public Records
Tax History Compared to Growth
Tax History
| Year | Tax Paid | Tax Assessment Tax Assessment Total Assessment is a certain percentage of the fair market value that is determined by local assessors to be the total taxable value of land and additions on the property. | Land | Improvement |
|---|---|---|---|---|
| 2025 | $19,488 | $1,711,000 | $942,000 | $769,000 |
| 2024 | $18,512 | $1,753,000 | $1,174,000 | $579,000 |
| 2023 | $16,309 | $1,451,000 | $895,000 | $556,000 |
| 2022 | $15,433 | $1,335,000 | $819,000 | $516,000 |
| 2021 | $16,144 | $1,399,000 | $896,000 | $503,000 |
| 2020 | $16,115 | $1,465,000 | $956,000 | $509,000 |
| 2019 | $14,331 | $1,228,000 | $746,000 | $482,000 |
| 2018 | $6 | $1,071,000 | $603,000 | $468,000 |
| 2017 | $6,189 | $1,016,000 | $553,000 | $463,000 |
| 2016 | $12,723 | $1,013,000 | $553,000 | $460,000 |
| 2015 | $10,230 | $793,000 | $472,000 | $321,000 |
Source: Public Records
Map
Nearby Homes
- 263 Common St
- 1 Spinney Terrace
- 69 Horace Rd
- 38 Myrtle St
- 160 Waverley St
- 66 Channing Rd
- 72-74 Flett Rd
- 23 Centre Ave
- 59-61 Gilbert Rd
- 55-57 Hawthorne St
- 36 Madison St
- 248 School St
- 33 Slade St Unit 1
- 33 Wellington Ln
- 2 Bartlett Ave Unit 1
- 125 Trapelo Rd Unit 21
- 125 Trapelo Rd Unit 23
- 105 Watson Rd
- 88 Bartlett Ave
- 48 Concord Ave