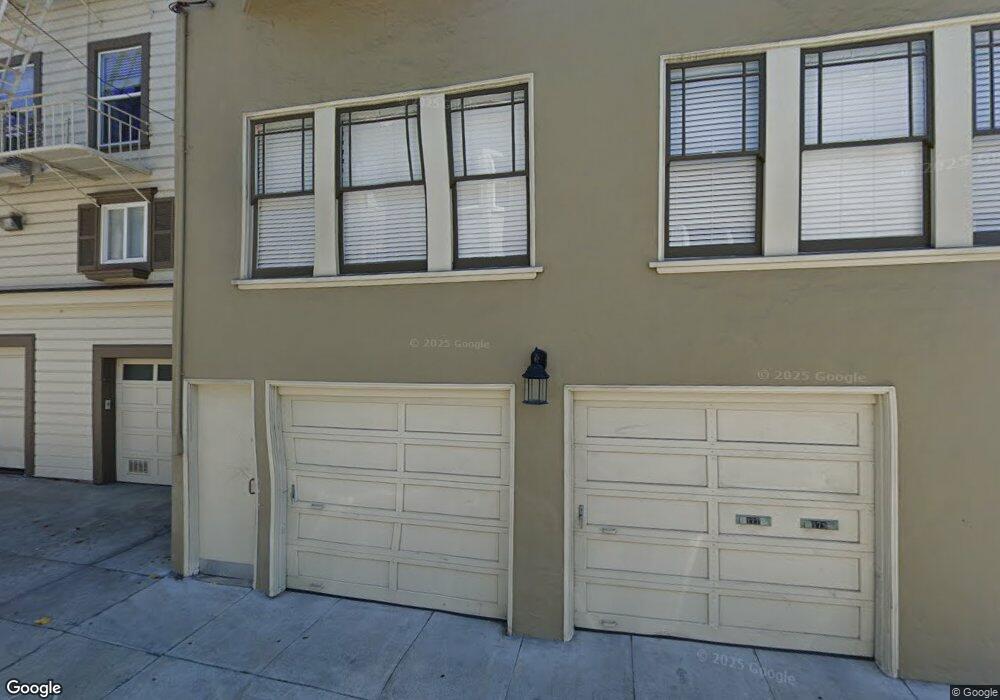
177 Pixley St Unit 177 San Francisco, CA 94123
Cow Hollow NeighborhoodEstimated Value: $1,287,390 - $1,469,000
2
Beds
2
Baths
1,269
Sq Ft
$1,104/Sq Ft
Est. Value
About This Home
This home is located at 177 Pixley St Unit 177, San Francisco, CA 94123 and is currently estimated at $1,400,848, approximately $1,103 per square foot. 177 Pixley St Unit 177 is a home located in San Francisco County with nearby schools including Sherman Elementary, Marina Middle School, and Mary L. Booker Leadership Academy.
Ownership History
Date
Name
Owned For
Owner Type
Purchase Details
Closed on
Jul 1, 2016
Sold by
Ng Lori Lynn
Bought by
Ng Lori
Current Estimated Value
Purchase Details
Closed on
Sep 5, 2003
Sold by
Silver Gary D
Bought by
Silver Gary D
Purchase Details
Closed on
Jul 5, 1997
Sold by
Molano Michael A and Molano Stacy R
Bought by
Silver Gary D
Home Financials for this Owner
Home Financials are based on the most recent Mortgage that was taken out on this home.
Original Mortgage
$284,800
Outstanding Balance
$42,010
Interest Rate
7.83%
Estimated Equity
$1,358,838
Purchase Details
Closed on
Nov 27, 1995
Sold by
Gardner Curtis S
Bought by
Molano Michael A and Molano Stacy R
Home Financials for this Owner
Home Financials are based on the most recent Mortgage that was taken out on this home.
Original Mortgage
$232,500
Interest Rate
7.12%
Purchase Details
Closed on
Nov 8, 1994
Sold by
Brown John C and Brown Vicki L Stern
Bought by
Gardner Curtis S
Create a Home Valuation Report for This Property
The Home Valuation Report is an in-depth analysis detailing your home's value as well as a comparison with similar homes in the area
Home Values in the Area
Average Home Value in this Area
Purchase History
| Date | Buyer | Sale Price | Title Company |
|---|---|---|---|
| Ng Lori | -- | None Available | |
| Silver Gary D | -- | -- | |
| Silver Gary D | $355,882 | Chicago Title Co | |
| Molano Michael A | $258,500 | Commonwealth Land Title Co | |
| Gardner Curtis S | -- | Fidelity National Title Co |
Source: Public Records
Mortgage History
| Date | Status | Borrower | Loan Amount |
|---|---|---|---|
| Open | Silver Gary D | $284,800 | |
| Previous Owner | Molano Michael A | $232,500 | |
| Closed | Silver Gary D | $35,600 |
Source: Public Records
Tax History Compared to Growth
Tax History
| Year | Tax Paid | Tax Assessment Tax Assessment Total Assessment is a certain percentage of the fair market value that is determined by local assessors to be the total taxable value of land and additions on the property. | Land | Improvement |
|---|---|---|---|---|
| 2025 | $12,512 | $1,027,908 | $554,492 | $473,416 |
| 2024 | $12,512 | $1,007,754 | $543,620 | $464,134 |
| 2023 | $12,319 | $987,995 | $532,961 | $455,034 |
| 2022 | $12,077 | $968,624 | $522,511 | $446,113 |
| 2021 | $11,860 | $949,632 | $512,266 | $437,366 |
| 2020 | $11,921 | $939,896 | $507,014 | $432,882 |
| 2019 | $11,512 | $921,468 | $497,073 | $424,395 |
| 2018 | $11,124 | $903,401 | $487,327 | $416,074 |
| 2017 | $10,693 | $885,688 | $477,772 | $407,916 |
| 2016 | $10,509 | $868,322 | $468,404 | $399,918 |
| 2015 | $10,377 | $855,281 | $461,369 | $393,912 |
| 2014 | $10,103 | $838,529 | $452,332 | $386,197 |
Source: Public Records
Map
Nearby Homes
- 2100 Green St Unit 206
- 35 Moulton St Unit 2
- 3110 Buchanan St
- 1930 Lombard St
- 115 Magnolia St
- 2384 Union St
- 2160 Vallejo St
- 3208 Pierce St Unit 406
- 3131 Pierce St Unit 406
- 2755 Fillmore St
- 2724 2728 Filbert St
- 2190 Broadway St Unit 1W
- 1864 Greenwich St
- 2040 Broadway St Unit 102
- 1998 Vallejo St Unit 2
- 2550 Greenwich St
- 2200 Pacific Ave Unit 8E
- 2200 Pacific Ave Unit 9E
- 3110 Octavia St
- 2467 Pacific Ave
- 179 Pixley St Unit 179
- 2180 Filbert St Unit 2182
- 161 Pixley St Unit 163
- 2170 Filbert St Unit 201
- 2170 Filbert St Unit 304
- 2170 Filbert St Unit 204
- 2170 Filbert St
- 2170 Filbert St Unit 202
- 2170 Filbert St Unit 203
- 2170 Filbert St Unit 303
- 2170 Filbert St Unit 302
- 155 Pixley St
- 2158 Filbert St
- 176 Pixley St Unit 178
- 184 Pixley St
- 170 Pixley St
- 2154 Filbert St Unit 2156
- 160 Pixley St
- 149 Pixley St Unit 149
- 2148 Filbert St Unit 2148