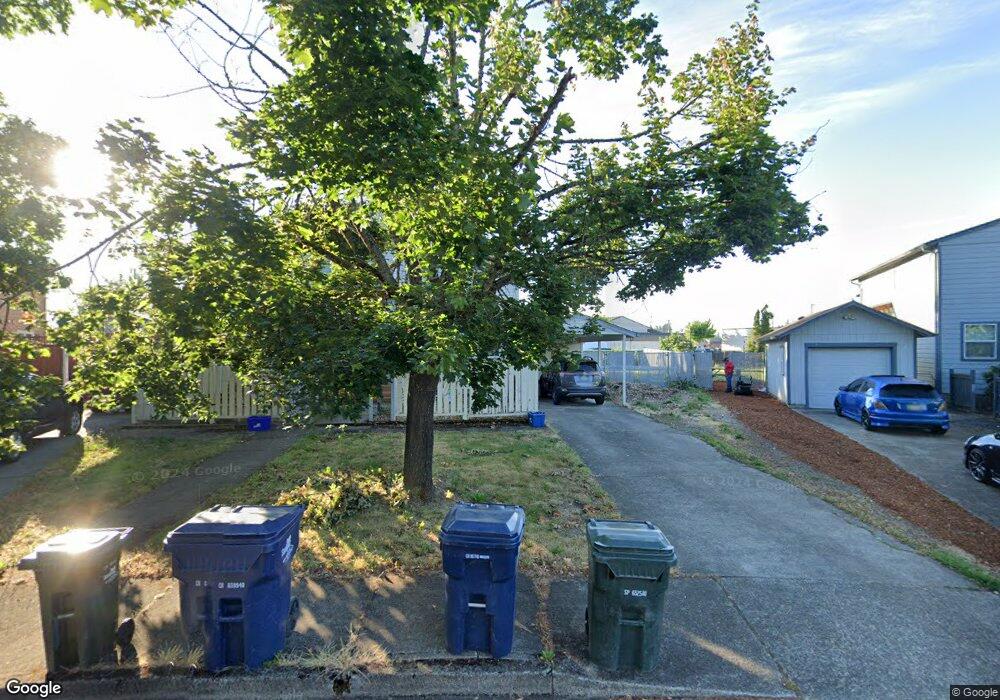
177 Smith Loop Springfield, OR 97478
East Springfield NeighborhoodEstimated Value: $451,000 - $525,000
6
Beds
4
Baths
2,268
Sq Ft
$217/Sq Ft
Est. Value
About This Home
This home is located at 177 Smith Loop, Springfield, OR 97478 and is currently estimated at $492,015, approximately $216 per square foot. 177 Smith Loop is a home located in Lane County with nearby schools including Riverbend Elementary School, Agnes Stewart Middle School, and Thurston High School.
Ownership History
Date
Name
Owned For
Owner Type
Purchase Details
Closed on
Jan 31, 2013
Sold by
Fitzgerald Tamra J and Claman Tamra J
Bought by
Zimmerman J Wayne and The Zimmerman Revocable Living Trust
Current Estimated Value
Purchase Details
Closed on
Jun 21, 2011
Sold by
Claman Jack S
Bought by
Claman Tamra J
Purchase Details
Closed on
Apr 4, 2000
Sold by
Fitzgerald Reuben E and Fitzgerald Mary K
Bought by
Claman Jack S and Claman Tamra J
Home Financials for this Owner
Home Financials are based on the most recent Mortgage that was taken out on this home.
Original Mortgage
$150,000
Interest Rate
7.84%
Mortgage Type
Seller Take Back
Create a Home Valuation Report for This Property
The Home Valuation Report is an in-depth analysis detailing your home's value as well as a comparison with similar homes in the area
Home Values in the Area
Average Home Value in this Area
Purchase History
| Date | Buyer | Sale Price | Title Company |
|---|---|---|---|
| Zimmerman J Wayne | $164,000 | Western Title & Escrow Co | |
| Claman Tamra J | -- | None Available | |
| Claman Jack S | $150,000 | Evergreen Land Title Co |
Source: Public Records
Mortgage History
| Date | Status | Borrower | Loan Amount |
|---|---|---|---|
| Previous Owner | Claman Jack S | $150,000 |
Source: Public Records
Tax History
| Year | Tax Paid | Tax Assessment Tax Assessment Total Assessment is a certain percentage of the fair market value that is determined by local assessors to be the total taxable value of land and additions on the property. | Land | Improvement |
|---|---|---|---|---|
| 2025 | $4,704 | $256,548 | -- | -- |
| 2024 | $4,628 | $249,076 | -- | -- |
| 2023 | $4,628 | $241,822 | $0 | $0 |
| 2022 | $4,287 | $234,779 | $0 | $0 |
| 2021 | $4,368 | $236,538 | $0 | $0 |
| 2020 | $4,241 | $229,649 | $0 | $0 |
| 2019 | $4,113 | $222,961 | $0 | $0 |
| 2018 | $3,877 | $210,162 | $0 | $0 |
| 2017 | $3,728 | $210,162 | $0 | $0 |
| 2016 | $3,650 | $204,041 | $0 | $0 |
| 2015 | $3,407 | $198,098 | $0 | $0 |
| 2014 | $3,506 | $193,056 | $0 | $0 |
Source: Public Records
Map
Nearby Homes
Your Personal Tour Guide
Ask me questions while you tour the home.