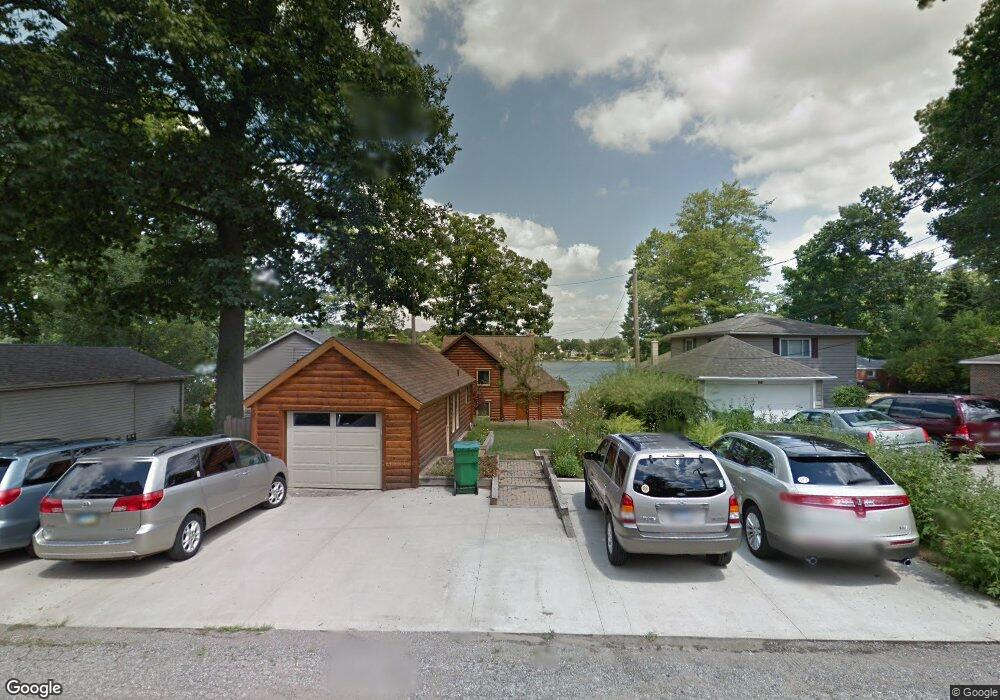
177 St Marys Lake Rd Battle Creek, MI 49017
Estimated Value: $303,000 - $585,000
3
Beds
2
Baths
2,011
Sq Ft
$235/Sq Ft
Est. Value
About This Home
This home is located at 177 St Marys Lake Rd, Battle Creek, MI 49017 and is currently estimated at $473,129, approximately $235 per square foot. 177 St Marys Lake Rd is a home located in Calhoun County with nearby schools including Pennfield Dunlap Elementary School, North Pennfield Elementary School, and Pennfield Middle School.
Ownership History
Date
Name
Owned For
Owner Type
Purchase Details
Closed on
Oct 21, 2016
Sold by
Speers Brooke J
Bought by
Freeman Benjamin W
Current Estimated Value
Home Financials for this Owner
Home Financials are based on the most recent Mortgage that was taken out on this home.
Original Mortgage
$232,750
Outstanding Balance
$186,356
Interest Rate
3.42%
Mortgage Type
New Conventional
Estimated Equity
$286,773
Purchase Details
Closed on
Jun 29, 2011
Sold by
Fannie Mae
Bought by
Speers Brooke J
Home Financials for this Owner
Home Financials are based on the most recent Mortgage that was taken out on this home.
Original Mortgage
$145,000
Interest Rate
4.56%
Mortgage Type
New Conventional
Purchase Details
Closed on
Aug 12, 2010
Sold by
Berger Sarah J and Berger Johan S
Bought by
Federal National Mortgage Association
Purchase Details
Closed on
Nov 7, 2002
Sold by
Chochoff Lewis and Chochoff Rada
Bought by
Berger Johan and Berger Sarah
Create a Home Valuation Report for This Property
The Home Valuation Report is an in-depth analysis detailing your home's value as well as a comparison with similar homes in the area
Home Values in the Area
Average Home Value in this Area
Purchase History
| Date | Buyer | Sale Price | Title Company |
|---|---|---|---|
| Freeman Benjamin W | $245,000 | None Available | |
| Speers Brooke J | $185,000 | Etitle Agency Inc | |
| Federal National Mortgage Association | $462,527 | None Available | |
| Berger Johan | $120,000 | -- |
Source: Public Records
Mortgage History
| Date | Status | Borrower | Loan Amount |
|---|---|---|---|
| Open | Freeman Benjamin W | $232,750 | |
| Previous Owner | Speers Brooke J | $145,000 |
Source: Public Records
Tax History Compared to Growth
Tax History
| Year | Tax Paid | Tax Assessment Tax Assessment Total Assessment is a certain percentage of the fair market value that is determined by local assessors to be the total taxable value of land and additions on the property. | Land | Improvement |
|---|---|---|---|---|
| 2025 | $7,028 | $233,200 | $0 | $0 |
| 2024 | $3,134 | $254,900 | $0 | $0 |
| 2023 | $6,073 | $236,980 | $0 | $0 |
| 2022 | $2,843 | $216,890 | $0 | $0 |
| 2021 | $6,138 | $207,610 | $0 | $0 |
| 2020 | $6,052 | $139,000 | $0 | $0 |
| 2019 | $6,019 | $133,530 | $0 | $0 |
| 2018 | $5,604 | $140,170 | $17,340 | $122,830 |
| 2017 | -- | $137,170 | $0 | $0 |
| 2016 | -- | $157,340 | $0 | $0 |
| 2015 | -- | $161,040 | $2,948 | $158,092 |
| 2014 | -- | $152,040 | $2,948 | $149,092 |
Source: Public Records
Map
Nearby Homes
- 6381 Saint Marys Lake Rd
- 850 Sylvan Dr
- 855 Sylvan Dr
- 118 Red Bird Ln
- 5658 Bauman Rd
- 0 Bauman Rd Unit 25034846
- 0 Bauman Rd Unit 25034837
- V/L East Ave N
- 146 Indian Rd
- 106 Buckingham
- 228 Indian Rd
- 117 Old Lantern Trail
- 22150 East Ave N
- 115 Briars Farm Ln
- 21520 Swafford Rd
- 19687 East Ave N
- 6329 Purdy Dr
- 6722 Morgan Rd E
- 104 Calico Ln
- 138 Knoll Dr
- 178 St Marys Lake Rd
- 176 St Marys Lake Rd
- 176 Saint Marys Lake Rd
- 178 Saint Marys Lake Rd
- 175 St Marys Lake Rd
- 201 St Marys Lake Rd
- 201 St Marys Lake Rd
- 21120 Crane Ct
- 203 St Marys Lake Rd
- 171 St Marys Lake Rd
- 198 St Marys Lake Rd
- 172 Saint Marys Lake Rd
- 172 St Marys Lake Rd
- 21106 Crane Ct
- 204 St Marys Lake Rd
- 294 St Marys Lake Rd
- 299 St Marys Lake Rd
- 297 St Marys Lake Rd
- 296 St Marys Lake Rd
- 292 St Marys Lake Rd