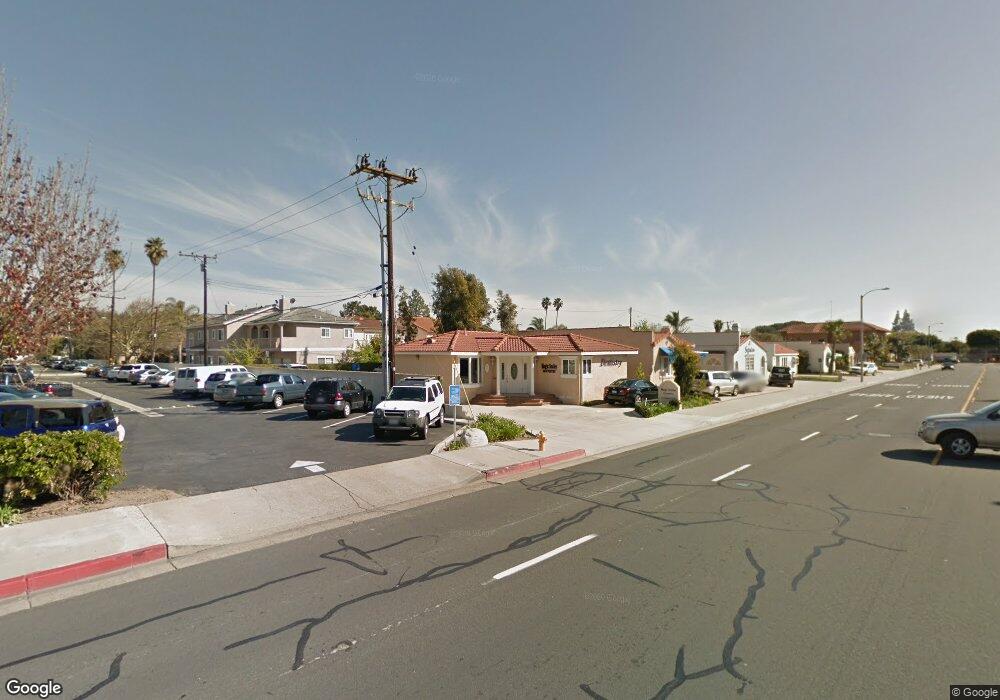
177 Yorba St Tustin, CA 92780
Estimated Value: $1,004,062
2
Beds
1
Bath
1,120
Sq Ft
$896/Sq Ft
Est. Value
About This Home
This home is located at 177 Yorba St, Tustin, CA 92780 and is currently estimated at $1,004,062, approximately $896 per square foot. 177 Yorba St is a home located in Orange County with nearby schools including Helen Estock Elementary School, Columbus Tustin Middle School, and Foothill High School.
Ownership History
Date
Name
Owned For
Owner Type
Purchase Details
Closed on
Jan 2, 2019
Sold by
Equity Holding Corp
Bought by
111 N Euclid St Property Llc
Current Estimated Value
Home Financials for this Owner
Home Financials are based on the most recent Mortgage that was taken out on this home.
Original Mortgage
$975,000
Outstanding Balance
$858,955
Interest Rate
4.7%
Mortgage Type
Small Business Administration
Estimated Equity
$145,107
Purchase Details
Closed on
May 12, 2008
Sold by
Manzari Tom and Khatami Sedigheh
Bought by
Equity Holding Corp
Purchase Details
Closed on
Jun 2, 2006
Sold by
Manzari Johnnie B
Bought by
Manzari Tom and Khatami Sedigheh
Purchase Details
Closed on
Jul 26, 2000
Sold by
Jenny Jechart
Bought by
Manzari Johnnie B
Home Financials for this Owner
Home Financials are based on the most recent Mortgage that was taken out on this home.
Original Mortgage
$192,000
Interest Rate
8.07%
Mortgage Type
Commercial
Create a Home Valuation Report for This Property
The Home Valuation Report is an in-depth analysis detailing your home's value as well as a comparison with similar homes in the area
Home Values in the Area
Average Home Value in this Area
Purchase History
| Date | Buyer | Sale Price | Title Company |
|---|---|---|---|
| 111 N Euclid St Property Llc | $600,000 | Chicago Title Company | |
| Equity Holding Corp | -- | California Title Company | |
| Manzari Tom | -- | Accommodation | |
| Manzari Johnnie B | $240,000 | First Southwestern Title Co |
Source: Public Records
Mortgage History
| Date | Status | Borrower | Loan Amount |
|---|---|---|---|
| Open | 111 N Euclid St Property Llc | $975,000 | |
| Previous Owner | Manzari Johnnie B | $192,000 |
Source: Public Records
Tax History Compared to Growth
Tax History
| Year | Tax Paid | Tax Assessment Tax Assessment Total Assessment is a certain percentage of the fair market value that is determined by local assessors to be the total taxable value of land and additions on the property. | Land | Improvement |
|---|---|---|---|---|
| 2025 | $7,718 | $669,309 | $557,759 | $111,550 |
| 2024 | $7,718 | $656,186 | $546,823 | $109,363 |
| 2023 | $7,526 | $643,320 | $536,101 | $107,219 |
| 2022 | $7,409 | $630,706 | $525,589 | $105,117 |
| 2021 | $7,263 | $618,340 | $515,284 | $103,056 |
| 2020 | $7,225 | $612,000 | $510,000 | $102,000 |
| 2019 | $4,753 | $384,604 | $262,774 | $121,830 |
| 2018 | $4,679 | $377,063 | $257,621 | $119,442 |
| 2017 | $4,601 | $369,670 | $252,570 | $117,100 |
| 2016 | $4,522 | $362,422 | $247,618 | $114,804 |
| 2015 | $4,629 | $356,979 | $243,899 | $113,080 |
| 2014 | $4,517 | $349,987 | $239,122 | $110,865 |
Source: Public Records
Map
Nearby Homes
- 157 Pacific St
- 155 Pasadena Ave
- 160 N B St
- 654 W Main St Unit B
- 631 W 6th St Unit D
- 119 Jessup Way
- 282 Prospect Park
- 139 Jessup Way
- 141 E Coronado Ln
- 1006 Overton Ct
- 158 E De Anza Ln Unit 175
- 453 E 1st St
- 129 Colombo Ln
- 107 S Portola Ln Unit 41
- 15500 Tustin Village Way Unit 15
- 131 Colombo Ln
- 16667 Montego Way
- 1882 E 1st St Unit 260
- 17841 Lucero Way
- 1818 E 1st St Unit 520
- 173 Yorba St
- 170 Mountain View Dr
- 168 Mountain View Dr
- 165 Yorba St
- 160 Mountain View Dr
- 17332 Irvine Blvd
- 158 Mountain View Dr
- 163 Yorba St
- 14891 Yorba St
- 150 Mountain View Dr
- 148 Mountain View Dr
- 15902 Yorba St Unit 15A
- 14841 Yorba St
- 140 Mountain View Dr
- 151 Yorba St
- 151 Yorba St Unit 102
- 155 Mountain View Dr
- 175 Mountain View Dr
- 138 Mountain View Dr
- 165 Mountain View Dr