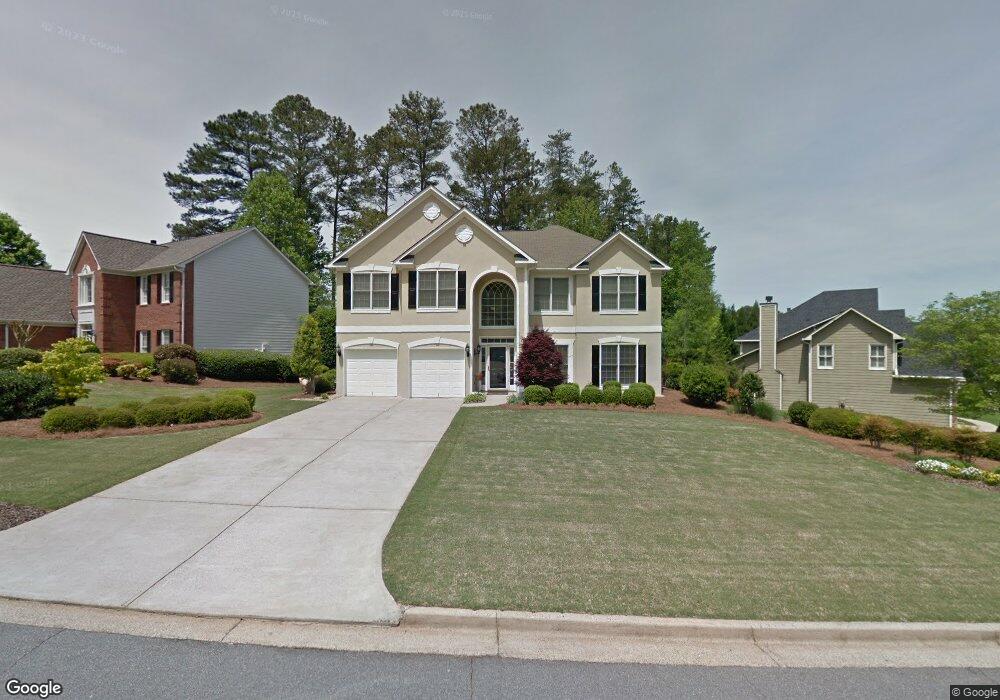
1770 Millhouse Run Unit 1 Marietta, GA 30066
Sandy Plains NeighborhoodEstimated Value: $517,000 - $636,000
4
Beds
3
Baths
2,990
Sq Ft
$192/Sq Ft
Est. Value
About This Home
This home is located at 1770 Millhouse Run Unit 1, Marietta, GA 30066 and is currently estimated at $573,358, approximately $191 per square foot. 1770 Millhouse Run Unit 1 is a home located in Cobb County with nearby schools including Keheley Elementary School and McCleskey Middle School.
Ownership History
Date
Name
Owned For
Owner Type
Purchase Details
Closed on
Dec 9, 2022
Sold by
Newman Samuel D
Bought by
Samuel And Andrene Newman Revocable Trust
Current Estimated Value
Purchase Details
Closed on
Mar 18, 2003
Sold by
Ferraro Scott A and Ferraro Pamela L
Bought by
Newman Samuel D and Newman Andrene E
Home Financials for this Owner
Home Financials are based on the most recent Mortgage that was taken out on this home.
Original Mortgage
$187,500
Interest Rate
5.86%
Mortgage Type
New Conventional
Purchase Details
Closed on
Aug 31, 1999
Sold by
Ryland Group Inc
Bought by
Ferraro Scott A and Ferraro Pamela L
Home Financials for this Owner
Home Financials are based on the most recent Mortgage that was taken out on this home.
Original Mortgage
$211,400
Interest Rate
7.73%
Mortgage Type
New Conventional
Create a Home Valuation Report for This Property
The Home Valuation Report is an in-depth analysis detailing your home's value as well as a comparison with similar homes in the area
Home Values in the Area
Average Home Value in this Area
Purchase History
| Date | Buyer | Sale Price | Title Company |
|---|---|---|---|
| Samuel And Andrene Newman Revocable Trust | -- | -- | |
| Newman Samuel D | $268,000 | -- | |
| Ferraro Scott A | $234,900 | -- |
Source: Public Records
Mortgage History
| Date | Status | Borrower | Loan Amount |
|---|---|---|---|
| Previous Owner | Newman Samuel D | $187,500 | |
| Previous Owner | Ferraro Scott A | $211,400 |
Source: Public Records
Tax History Compared to Growth
Tax History
| Year | Tax Paid | Tax Assessment Tax Assessment Total Assessment is a certain percentage of the fair market value that is determined by local assessors to be the total taxable value of land and additions on the property. | Land | Improvement |
|---|---|---|---|---|
| 2025 | $1,306 | $228,248 | $60,000 | $168,248 |
| 2024 | $1,310 | $228,248 | $60,000 | $168,248 |
| 2023 | $3,774 | $178,676 | $30,000 | $148,676 |
| 2022 | $4,350 | $178,676 | $30,000 | $148,676 |
| 2021 | $3,657 | $147,020 | $30,000 | $117,020 |
| 2020 | $3,563 | $142,732 | $30,000 | $112,732 |
| 2019 | $3,563 | $142,732 | $30,000 | $112,732 |
| 2018 | $3,054 | $119,444 | $30,000 | $89,444 |
| 2017 | $2,939 | $119,444 | $30,000 | $89,444 |
| 2016 | $2,818 | $113,748 | $30,000 | $83,748 |
| 2015 | $2,578 | $100,224 | $26,000 | $74,224 |
| 2014 | $2,598 | $100,224 | $0 | $0 |
Source: Public Records
Map
Nearby Homes
- 4056 Longford Dr NE
- 2124 Lassiter Field Dr NE
- 4499 Browning Ct NE
- 2402 Woodbridge Dr
- 2603 Chadwick Rd
- 3844 Havenrock
- 2610 Chadwick Rd
- 4050 Idlewilde Meadows Dr NE
- 3816 Havenrock Dr
- 4281 Keheley Lake Dr NE
- 4181 Keheley Dr NE
- 4509 N Landing Dr
- 4314 Keheley Lake Ct NE
- 3812 Havenrock Dr
- 4509 N Bay Ct
- 1849 Service Dr NE
- 1740 Latour Dr NE
- 1766 Millhouse Run
- 1774 Millhouse Run
- 1762 Millhouse Run
- 1769 Millhouse Run
- 1778 Millhouse Run Unit 1778
- 1778 Millhouse Run Unit 1
- 1778 Millhouse Run
- 1767 Millhouse Run Unit 1
- 1767 Millhouse Run
- 1825 Rockybranch Pass Unit I
- 1771 Millhouse Run
- 1760 Millhouse Run
- 1775 Millhouse Run
- 1773 Millhouse Run Unit 1
- 1777 Millhouse Run
- 1763 Millhouse Run
- 1779 Millhouse Run
- 1823 Rockybranch Pass
- 1758 Millhouse Run Unit 1
- 1761 Millhouse Run