Estimated Value: $474,796 - $680,000
3
Beds
2
Baths
2,600
Sq Ft
$228/Sq Ft
Est. Value
About This Home
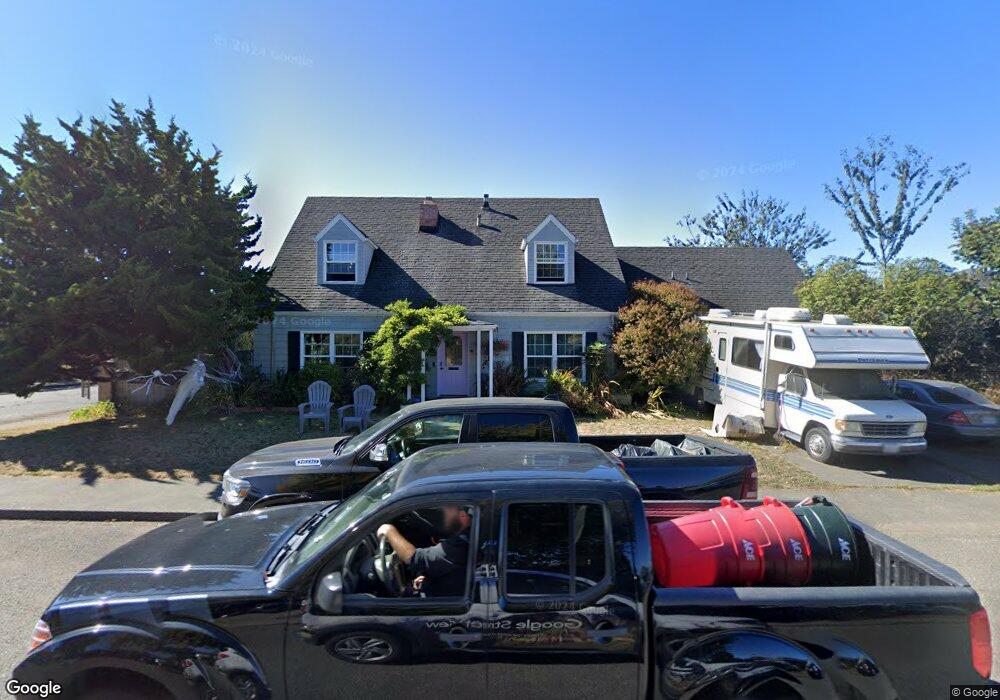
This home is located at 1770 P St, Eureka, CA 95501 and is currently estimated at $593,949, approximately $228 per square foot. 1770 P St is a home located in Humboldt County with nearby schools including Washington Elementary School, Catherine L. Zane Middle School, and Eureka Senior High School.
Ownership History
Date
Name
Owned For
Owner Type
Purchase Details
Closed on
Apr 8, 2004
Sold by
Marchi Nicholas R and Marchi Carey
Bought by
Mccall Joshua and Izatt Julie A
Current Estimated Value
Home Financials for this Owner
Home Financials are based on the most recent Mortgage that was taken out on this home.
Original Mortgage
$260,000
Outstanding Balance
$121,499
Interest Rate
5.56%
Mortgage Type
Purchase Money Mortgage
Estimated Equity
$472,450
Purchase Details
Closed on
Aug 17, 1998
Sold by
Marchi Nicholas R
Bought by
Marchi Nicholas R and Marchi Carey
Purchase Details
Closed on
Aug 15, 1997
Sold by
Pierce James L and Pierce Gail C
Bought by
Marchi Nicholas R
Create a Home Valuation Report for This Property
The Home Valuation Report is an in-depth analysis detailing your home's value as well as a comparison with similar homes in the area
Home Values in the Area
Average Home Value in this Area
Purchase History
| Date | Buyer | Sale Price | Title Company |
|---|---|---|---|
| Mccall Joshua | $325,000 | First American Title Ins Co | |
| Marchi Nicholas R | -- | -- | |
| Marchi Nicholas R | $207,000 | Humboldt Land Title Company |
Source: Public Records
Mortgage History
| Date | Status | Borrower | Loan Amount |
|---|---|---|---|
| Open | Mccall Joshua | $260,000 |
Source: Public Records
Tax History
| Year | Tax Paid | Tax Assessment Tax Assessment Total Assessment is a certain percentage of the fair market value that is determined by local assessors to be the total taxable value of land and additions on the property. | Land | Improvement |
|---|---|---|---|---|
| 2025 | $5,369 | $462,064 | $92,406 | $369,658 |
| 2024 | $5,369 | $453,005 | $90,595 | $362,410 |
| 2023 | $5,280 | $444,123 | $88,819 | $355,304 |
| 2022 | $5,057 | $435,416 | $87,078 | $348,338 |
| 2021 | $4,939 | $426,879 | $85,371 | $341,508 |
| 2020 | $4,903 | $422,503 | $84,496 | $338,007 |
| 2019 | $4,797 | $414,220 | $82,840 | $331,380 |
| 2018 | $4,716 | $406,099 | $81,216 | $324,883 |
| 2017 | $4,673 | $398,137 | $79,624 | $318,513 |
| 2016 | $4,659 | $390,331 | $78,063 | $312,268 |
| 2015 | $4,621 | $384,469 | $76,891 | $307,578 |
| 2014 | $4,335 | $376,938 | $75,385 | $301,553 |
Source: Public Records
Map
Nearby Homes
Your Personal Tour Guide
Ask me questions while you tour the home.