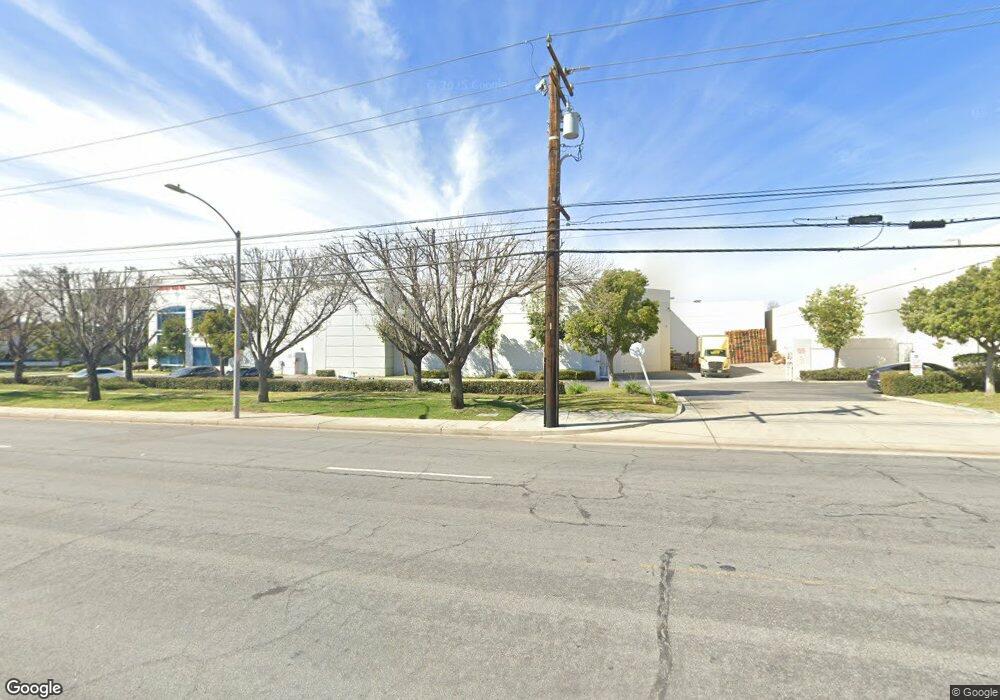
1770 S Vineyard Ave Unit C Ontario, CA 91761
Downtown Ontario NeighborhoodEstimated Value: $9,074,546
--
Bed
--
Bath
26,283
Sq Ft
$345/Sq Ft
Est. Value
About This Home
This home is located at 1770 S Vineyard Ave Unit C, Ontario, CA 91761 and is currently estimated at $9,074,546, approximately $345 per square foot. 1770 S Vineyard Ave Unit C is a home located in San Bernardino County with nearby schools including Bon View Elementary, De Anza Middle, and Colony High.
Ownership History
Date
Name
Owned For
Owner Type
Purchase Details
Closed on
Oct 3, 2023
Sold by
Sunny & Living Home Products Usa Llc
Bought by
Adisha Properties Llc
Current Estimated Value
Home Financials for this Owner
Home Financials are based on the most recent Mortgage that was taken out on this home.
Original Mortgage
$2,975,000
Interest Rate
7.63%
Mortgage Type
New Conventional
Purchase Details
Closed on
Jan 12, 2017
Sold by
Ihome Products Inc
Bought by
Sunny & Livng Home Products Usa Llc
Purchase Details
Closed on
May 20, 2015
Sold by
Vineyard Commerce Center Llc
Bought by
Gw Realty Group and Yocom Baldwin Development
Home Financials for this Owner
Home Financials are based on the most recent Mortgage that was taken out on this home.
Original Mortgage
$1,760,000
Interest Rate
3.64%
Mortgage Type
Commercial
Purchase Details
Closed on
May 19, 2015
Sold by
Gw Realty Group
Bought by
Ihome Products Inc
Home Financials for this Owner
Home Financials are based on the most recent Mortgage that was taken out on this home.
Original Mortgage
$1,760,000
Interest Rate
3.64%
Mortgage Type
Commercial
Create a Home Valuation Report for This Property
The Home Valuation Report is an in-depth analysis detailing your home's value as well as a comparison with similar homes in the area
Home Values in the Area
Average Home Value in this Area
Purchase History
| Date | Buyer | Sale Price | Title Company |
|---|---|---|---|
| Adisha Properties Llc | $8,400,000 | Lawyers Title | |
| Sunny & Livng Home Products Usa Llc | $3,533,500 | None Available | |
| Gw Realty Group | -- | First American | |
| Ihome Products Inc | $3,525,000 | First American |
Source: Public Records
Mortgage History
| Date | Status | Borrower | Loan Amount |
|---|---|---|---|
| Previous Owner | Adisha Properties Llc | $2,975,000 | |
| Previous Owner | Ihome Products Inc | $1,760,000 |
Source: Public Records
Tax History Compared to Growth
Tax History
| Year | Tax Paid | Tax Assessment Tax Assessment Total Assessment is a certain percentage of the fair market value that is determined by local assessors to be the total taxable value of land and additions on the property. | Land | Improvement |
|---|---|---|---|---|
| 2025 | $91,674 | $8,568,000 | $5,712,000 | $2,856,000 |
| 2024 | $91,674 | $8,400,000 | $5,600,000 | $2,800,000 |
| 2023 | $41,478 | $3,941,549 | $737,358 | $3,204,191 |
| 2022 | $40,974 | $3,864,264 | $722,900 | $3,141,364 |
| 2021 | $40,695 | $3,788,494 | $708,725 | $3,079,769 |
| 2020 | $40,060 | $3,749,648 | $701,458 | $3,048,190 |
| 2019 | $39,826 | $3,676,126 | $687,704 | $2,988,422 |
| 2018 | $38,919 | $3,604,045 | $674,220 | $2,929,825 |
| 2017 | $38,941 | $3,650,332 | $684,502 | $2,965,830 |
| 2016 | $38,392 | $3,578,756 | $671,080 | $2,907,676 |
| 2015 | $24,416 | $2,245,079 | $342,283 | $1,902,796 |
| 2014 | -- | $2,201,101 | $335,578 | $1,865,523 |
Source: Public Records
Map
Nearby Homes
- 3641 E Eames St
- 1829 E Elm St
- 1456 E Philadelphia St Unit 134
- 1456 E Philadelphia St Unit 378
- 1456 E Philadelphia St
- 1456 E Philadelphia St Unit 279
- 1456 E Philadelphia St Unit 132
- 1456 E Philadelphia St Unit 39
- 1456 E Philadelphia St Unit 41
- 1456 E Philadelphia St Unit 311
- 1456 E Philadelphia St Unit 158
- 1456 E Philadelphia St Unit 109
- 1456 E Philadelphia St Unit 351
- 1456 E Philadelphia St Unit 154
- 1456 E Philadelphia St Unit 372
- 1456 E Philadelphia St Unit 331
- 1456 E Philadelphia St Unit 145
- 1456 E Philadelphia St Unit 182
- 1770 S Vineyard Ave
- 3590 E Peckham Paseo Unit 6
- 3560 E Peckham Paseo Unit 3
- 3721 S Allston Paseo Unit 1
- 3669 E Happy Paseo Unit 180
- 3625 E Delight Paseo Unit 141
- 4569 S Anniston Ave
- 3974 E Attalla St
- 3965 E Fincastle St
- 3982 E Fincastle St
- 4534 S Anniston Ave
- 4484 S Amherst Ave
- 3952 E Fincastle St
- 3326 S Honeysuckle Ave
- 2951 E Abbey Rd
- 3555 E Eames St
- 3541 E Delight Paseo
- 3369 E Sweetbay Way
- 3692 S Nexa Paseo
- 3676 S Brunswick Paseo