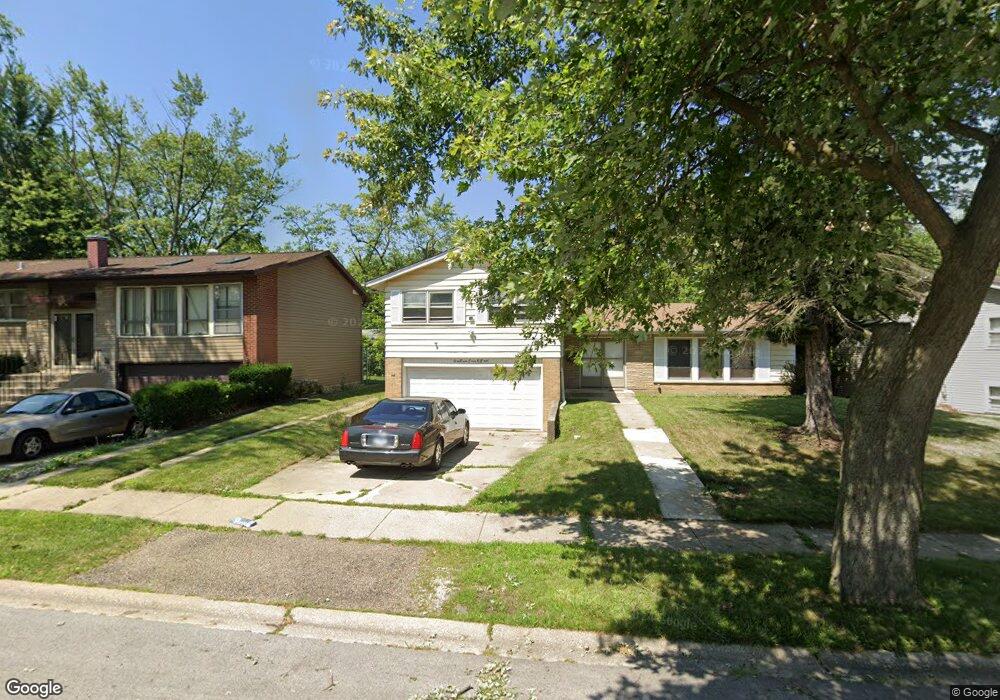
17708 Grandview Dr Unit 1 Hazel Crest, IL 60429
Stonebridge NeighborhoodEstimated Value: $228,234 - $313,000
4
Beds
3
Baths
1,495
Sq Ft
$170/Sq Ft
Est. Value
About This Home
This home is located at 17708 Grandview Dr Unit 1, Hazel Crest, IL 60429 and is currently estimated at $253,809, approximately $169 per square foot. 17708 Grandview Dr Unit 1 is a home located in Cook County with nearby schools including Mae Jemison School, Prairie-Hills Junior High School, and Hillcrest High School.
Ownership History
Date
Name
Owned For
Owner Type
Purchase Details
Closed on
Aug 29, 2025
Sold by
Ja Sfr 2 Llc
Bought by
Ja Sfr3 Llc
Current Estimated Value
Purchase Details
Closed on
Aug 7, 2020
Sold by
Chicago Re Investors Llc Series 17708
Bought by
Ja Sfr 2 Llc
Purchase Details
Closed on
Dec 27, 2013
Sold by
Green Andre
Bought by
Chicago Re Investors Llc Series 17708
Purchase Details
Closed on
Mar 20, 2008
Sold by
Winford Tonya
Bought by
Green Andre M and Green Chiretha
Home Financials for this Owner
Home Financials are based on the most recent Mortgage that was taken out on this home.
Original Mortgage
$157,528
Interest Rate
5.79%
Mortgage Type
FHA
Purchase Details
Closed on
Mar 31, 2006
Sold by
Mccurdy Thomas R
Bought by
Winford Tonya
Home Financials for this Owner
Home Financials are based on the most recent Mortgage that was taken out on this home.
Original Mortgage
$131,324
Interest Rate
6.89%
Mortgage Type
Purchase Money Mortgage
Create a Home Valuation Report for This Property
The Home Valuation Report is an in-depth analysis detailing your home's value as well as a comparison with similar homes in the area
Home Values in the Area
Average Home Value in this Area
Purchase History
| Date | Buyer | Sale Price | Title Company |
|---|---|---|---|
| Ja Sfr3 Llc | -- | None Listed On Document | |
| Ja Sfr 2 Llc | -- | Attorney | |
| Chicago Re Investors Llc Series 17708 | $46,500 | None Available | |
| Green Andre M | $160,000 | None Available | |
| Winford Tonya | $164,500 | Multiple | |
| Winford Tonya | $164,500 | Multiple |
Source: Public Records
Mortgage History
| Date | Status | Borrower | Loan Amount |
|---|---|---|---|
| Previous Owner | Green Andre M | $157,528 | |
| Previous Owner | Winford Tonya | $131,324 |
Source: Public Records
Tax History
| Year | Tax Paid | Tax Assessment Tax Assessment Total Assessment is a certain percentage of the fair market value that is determined by local assessors to be the total taxable value of land and additions on the property. | Land | Improvement |
|---|---|---|---|---|
| 2025 | $10,758 | $21,000 | $3,102 | $17,898 |
| 2024 | $10,758 | $21,000 | $3,102 | $17,898 |
| 2023 | $9,261 | $21,000 | $3,102 | $17,898 |
| 2022 | $9,261 | $12,615 | $2,737 | $9,878 |
| 2021 | $8,925 | $12,614 | $2,737 | $9,877 |
| 2020 | $8,474 | $12,614 | $2,737 | $9,877 |
| 2019 | $7,296 | $10,896 | $2,554 | $8,342 |
| 2018 | $7,070 | $10,896 | $2,554 | $8,342 |
| 2017 | $6,605 | $10,896 | $2,554 | $8,342 |
| 2016 | $6,112 | $10,453 | $2,189 | $8,264 |
| 2015 | $6,349 | $11,335 | $2,189 | $9,146 |
| 2014 | $6,192 | $11,335 | $2,189 | $9,146 |
| 2013 | $4,269 | $11,544 | $2,189 | $9,355 |
Source: Public Records
Map
Nearby Homes
- 17714 Dogwood Ln
- 17803 Dogwood Ln
- 2715 Knollwood Place
- 17805 Dogwood Ln
- 17613 Grandview Dr
- 17742 Larkspur Ln
- 17804 Pebblewood Ln
- 17731 Larkspur Ln
- 2908 Buttonwood Walk
- 2722 Cherrywood Place
- 2711 Larkspur Ln
- 5 E Carriageway Dr Unit 308
- 5 E Carriageway Dr Unit 201
- 3006 Buttonwood Walk
- 17718 Ridgewood Dr
- 7 E Carriageway Dr Unit 311
- 2900 175th St
- 17658 Lincoln Ave
- 18024 Marlin Ln
- 2912 175th St
- 17708 Grandview Dr
- 17706 Grandview Dr
- 17710 Grandview Dr
- 17715 Dogwood Ln
- 17704 Grandview Dr
- 17712 Grandview Dr
- 17713 Dogwood Ln
- 17711 Grandview Dr
- 17713 Grandview Dr
- 17717 Dogwood Ln
- 17709 Grandview Dr
- 17702 Grandview Dr
- 17715 Grandview Dr
- 17714 Grandview Dr
- 17711 Dogwood Ln
- 17707 Grandview Dr
- 17717 Grandview Dr
- 17700 Grandview Dr
- 17703 Grandview Dr
- 17716 Grandview Dr
Your Personal Tour Guide
Ask me questions while you tour the home.