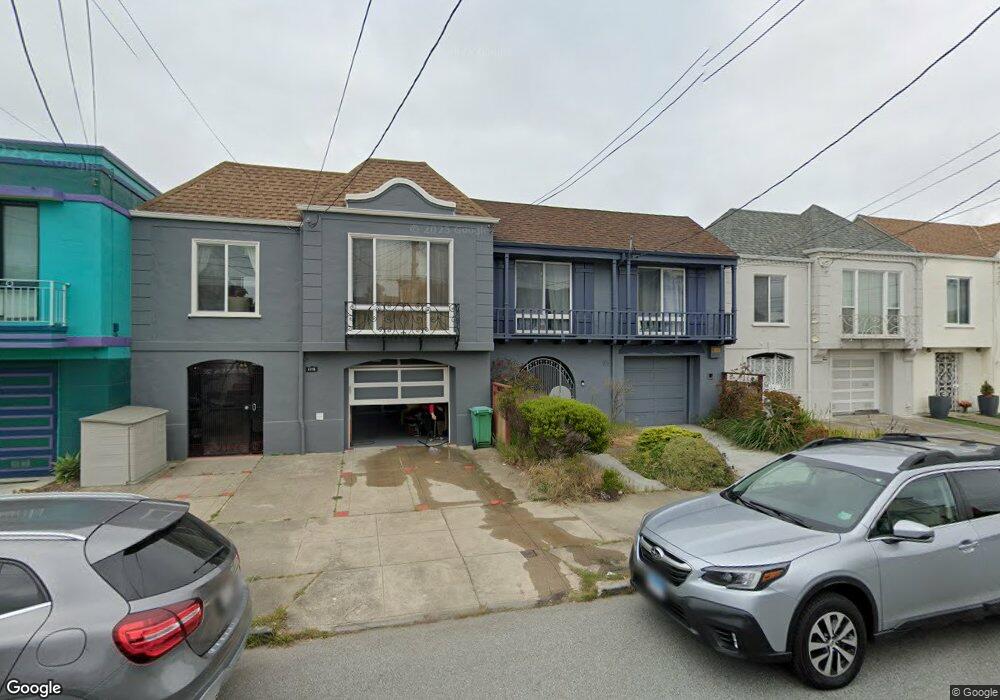
1771 29th Ave San Francisco, CA 94122
Central Sunset NeighborhoodEstimated Value: $1,256,000 - $1,571,000
2
Beds
1
Bath
1,125
Sq Ft
$1,287/Sq Ft
Est. Value
About This Home
This home is located at 1771 29th Ave, San Francisco, CA 94122 and is currently estimated at $1,447,978, approximately $1,287 per square foot. 1771 29th Ave is a home located in San Francisco County with nearby schools including Stevenson (Robert Louis) Elementary School, Giannini (A.P.) Middle School, and Cornerstone Academy-Lawton Campus.
Ownership History
Date
Name
Owned For
Owner Type
Purchase Details
Closed on
Feb 9, 1999
Sold by
San Aye Mg and Chan Khong H
Bought by
Lew Henry and Iwata Diane Micky
Current Estimated Value
Home Financials for this Owner
Home Financials are based on the most recent Mortgage that was taken out on this home.
Original Mortgage
$264,000
Outstanding Balance
$62,648
Interest Rate
6.77%
Estimated Equity
$1,385,330
Create a Home Valuation Report for This Property
The Home Valuation Report is an in-depth analysis detailing your home's value as well as a comparison with similar homes in the area
Home Values in the Area
Average Home Value in this Area
Purchase History
| Date | Buyer | Sale Price | Title Company |
|---|---|---|---|
| Lew Henry | $330,000 | Commonwealth Land Title Co |
Source: Public Records
Mortgage History
| Date | Status | Borrower | Loan Amount |
|---|---|---|---|
| Open | Lew Henry | $264,000 | |
| Closed | Lew Henry | $33,000 |
Source: Public Records
Tax History Compared to Growth
Tax History
| Year | Tax Paid | Tax Assessment Tax Assessment Total Assessment is a certain percentage of the fair market value that is determined by local assessors to be the total taxable value of land and additions on the property. | Land | Improvement |
|---|---|---|---|---|
| 2025 | $6,649 | $517,325 | $336,263 | $181,062 |
| 2024 | $6,649 | $507,182 | $329,670 | $177,512 |
| 2023 | $6,539 | $497,238 | $323,206 | $174,032 |
| 2022 | $6,401 | $487,489 | $316,869 | $170,620 |
| 2021 | $6,282 | $477,931 | $310,656 | $167,275 |
| 2020 | $6,325 | $473,031 | $307,471 | $165,560 |
| 2019 | $6,111 | $463,757 | $301,443 | $162,314 |
| 2018 | $5,905 | $454,665 | $295,533 | $159,132 |
| 2017 | $5,535 | $445,751 | $289,739 | $156,012 |
| 2016 | $5,423 | $437,011 | $284,058 | $152,953 |
| 2015 | $5,353 | $430,448 | $279,792 | $150,656 |
| 2014 | $5,212 | $422,017 | $274,312 | $147,705 |
Source: Public Records
Map
Nearby Homes