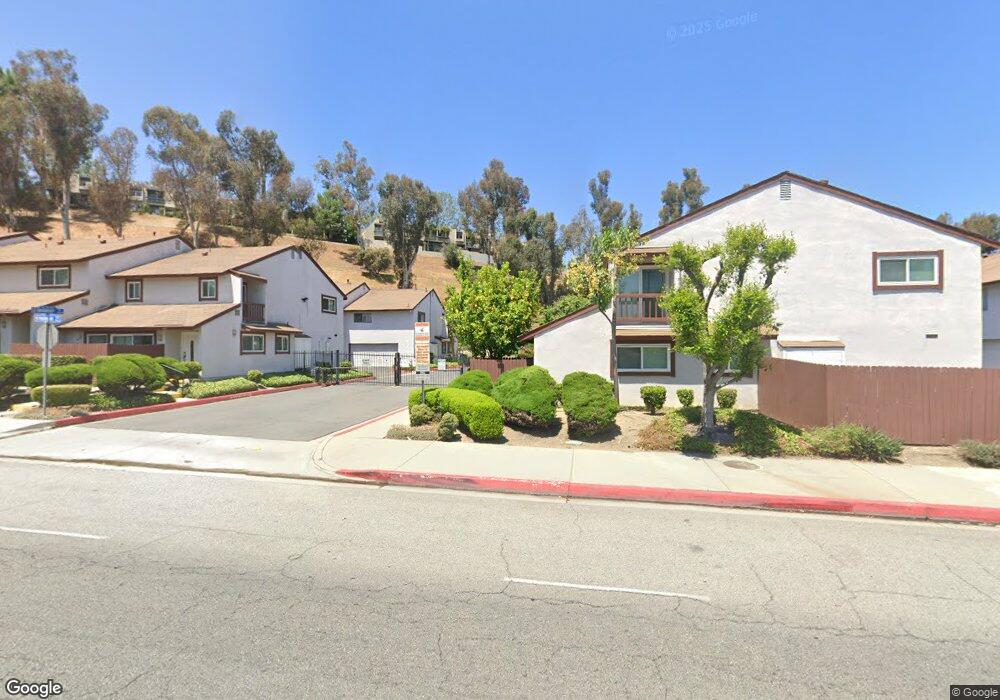
1771 Bradbury Dr Unit 13 Montebello, CA 90640
Estimated Value: $553,122 - $662,000
3
Beds
2
Baths
1,185
Sq Ft
$504/Sq Ft
Est. Value
About This Home
This home is located at 1771 Bradbury Dr Unit 13, Montebello, CA 90640 and is currently estimated at $597,281, approximately $504 per square foot. 1771 Bradbury Dr Unit 13 is a home located in Los Angeles County with nearby schools including Potrero Heights Elementary School, Macy Intermediate School, and Schurr High School.
Ownership History
Date
Name
Owned For
Owner Type
Purchase Details
Closed on
Dec 9, 2008
Sold by
Lopez Angel
Bought by
Lopez Angel and Angel Lopez Living Trust
Current Estimated Value
Purchase Details
Closed on
Oct 30, 2008
Sold by
Lopez Bertha Vazquez
Bought by
Lopez Angel
Purchase Details
Closed on
Sep 10, 2002
Sold by
Lopez Angel and Lopez Bertha
Bought by
Lopez Angel and Lopez Bertha
Home Financials for this Owner
Home Financials are based on the most recent Mortgage that was taken out on this home.
Original Mortgage
$136,000
Interest Rate
6.28%
Purchase Details
Closed on
May 24, 2002
Sold by
Hsiung Ku Chuen
Bought by
Lopez Angel and Lopez Bertha Vazquez
Purchase Details
Closed on
Feb 13, 2002
Sold by
Hsiung Man Chun
Bought by
Hsiung Ku Chuen
Home Financials for this Owner
Home Financials are based on the most recent Mortgage that was taken out on this home.
Original Mortgage
$112,000
Interest Rate
7.04%
Create a Home Valuation Report for This Property
The Home Valuation Report is an in-depth analysis detailing your home's value as well as a comparison with similar homes in the area
Home Values in the Area
Average Home Value in this Area
Purchase History
| Date | Buyer | Sale Price | Title Company |
|---|---|---|---|
| Lopez Angel | -- | None Available | |
| Lopez Angel | -- | None Available | |
| Lopez Angel | -- | Lawyers Title | |
| Lopez Angel | $170,000 | Ticor Title Insurance | |
| Hsiung Ku Chuen | -- | Ticor Title Insurance |
Source: Public Records
Mortgage History
| Date | Status | Borrower | Loan Amount |
|---|---|---|---|
| Closed | Lopez Angel | $136,000 | |
| Previous Owner | Hsiung Ku Chuen | $112,000 |
Source: Public Records
Tax History Compared to Growth
Tax History
| Year | Tax Paid | Tax Assessment Tax Assessment Total Assessment is a certain percentage of the fair market value that is determined by local assessors to be the total taxable value of land and additions on the property. | Land | Improvement |
|---|---|---|---|---|
| 2025 | $3,971 | $246,193 | $126,574 | $119,619 |
| 2024 | $3,971 | $241,367 | $124,093 | $117,274 |
| 2023 | $3,952 | $236,635 | $121,660 | $114,975 |
| 2022 | $3,819 | $231,996 | $119,275 | $112,721 |
| 2021 | $3,669 | $227,448 | $116,937 | $110,511 |
| 2019 | $3,496 | $220,703 | $113,469 | $107,234 |
| 2018 | $3,544 | $216,377 | $111,245 | $105,132 |
| 2016 | $3,396 | $207,976 | $106,926 | $101,050 |
| 2015 | $3,226 | $204,853 | $105,320 | $99,533 |
| 2014 | $3,189 | $200,841 | $103,257 | $97,584 |
Source: Public Records
Map
Nearby Homes
- 1728 Mountain Terrace Ln
- 1735 Mountain Terrace Ln Unit 73
- 1725 Neil Armstrong St Unit 103
- 1765 Neil Armstrong St Unit 202
- 1725 Neil Armstrong St Unit 106
- 185 Orchid Ct
- 1603 Firvale Ave
- 1640 Neil Armstrong St Unit 306
- 1620 Neil Armstrong St Unit 306
- 1661 Neil Armstrong St Unit 246
- 1661 Neil Armstrong St Unit 129
- 1610 Neil Armstrong St Unit 313
- 1610 Neil Armstrong St Unit 304
- 598 Alder Way
- 1525 San Gabriel Blvd
- 7672 Sunside Dr
- 8531 El Camino Dr
- 1540 Potrero Grande Dr Unit A
- Western Elite Plan at Metro Heights - Skyview
- Grand Elite Plan at Metro Heights - Skyview
- 1741 Bradbury Dr Unit 33
- 1767 Bradbury Dr Unit 22
- 1726 Bradbury Dr
- 1720 Bradbury Dr
- 1718 Bradbury Dr
- 1712 Bradbury Dr
- 1710 Bradbury Dr
- 1781 Bradbury Dr
- 1779 Bradbury Dr
- 1752 Bradbury Dr Unit 83
- 1750 Bradbury Dr
- 1748 Bradbury Dr
- 1746 Bradbury Dr
- 1742 Bradbury Dr
- 1736 Bradbury Dr
- 1751 Bradbury Dr
- 1749 Bradbury Dr
- 1765 Bradbury Dr
- 1777 Bradbury Dr
- 1773 Bradbury Dr