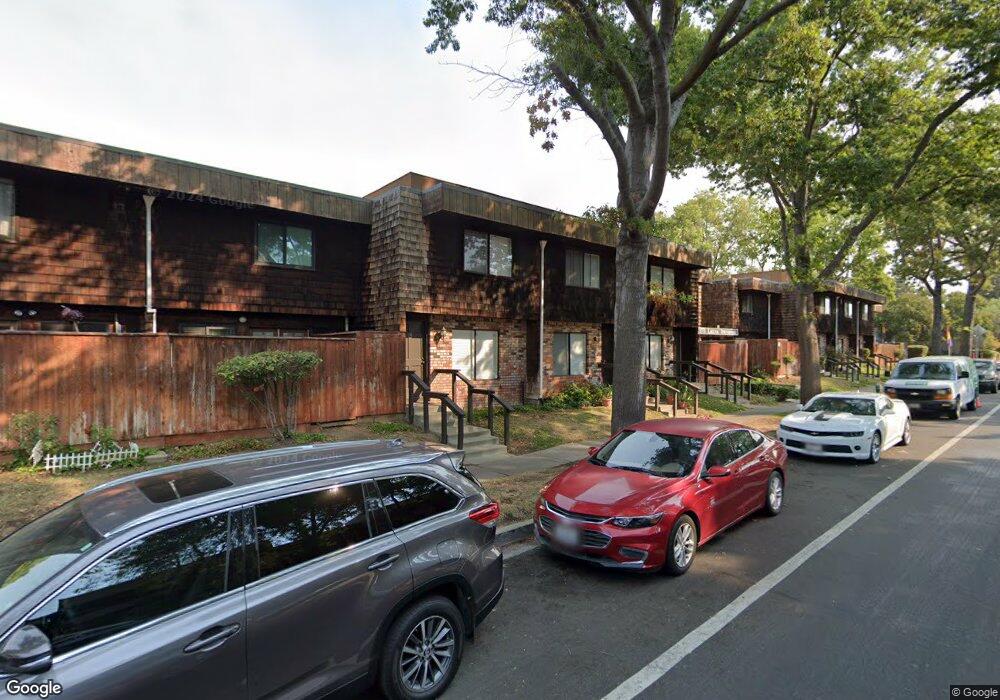
1771 Laguna St Unit 12 Concord, CA 94520
Islandis NeighborhoodEstimated Value: $323,264 - $439,000
2
Beds
2
Baths
1,040
Sq Ft
$365/Sq Ft
Est. Value
About This Home
This home is located at 1771 Laguna St Unit 12, Concord, CA 94520 and is currently estimated at $379,316, approximately $364 per square foot. 1771 Laguna St Unit 12 is a home located in Contra Costa County with nearby schools including Meadow Homes Elementary School, Oak Grove Middle School, and Mt. Diablo High School.
Ownership History
Date
Name
Owned For
Owner Type
Purchase Details
Closed on
May 10, 2021
Sold by
Cahill Nail Eileen W and Cahill Eileen W
Bought by
Cahill Nall Eileen W and Nall Kenneth T
Current Estimated Value
Home Financials for this Owner
Home Financials are based on the most recent Mortgage that was taken out on this home.
Original Mortgage
$165,000
Interest Rate
2.9%
Mortgage Type
New Conventional
Purchase Details
Closed on
Sep 14, 2007
Sold by
Cahill Eileen
Bought by
Cahill Eileen W
Purchase Details
Closed on
Feb 13, 2007
Sold by
Rocque Brian R and Cahill Eileen W
Bought by
Cahill Eileen
Home Financials for this Owner
Home Financials are based on the most recent Mortgage that was taken out on this home.
Original Mortgage
$162,500
Interest Rate
6.29%
Mortgage Type
Stand Alone Refi Refinance Of Original Loan
Create a Home Valuation Report for This Property
The Home Valuation Report is an in-depth analysis detailing your home's value as well as a comparison with similar homes in the area
Home Values in the Area
Average Home Value in this Area
Purchase History
| Date | Buyer | Sale Price | Title Company |
|---|---|---|---|
| Cahill Nall Eileen W | -- | Wfg Lender Services | |
| Cahill Eileen W | -- | None Available | |
| Cahill Eileen | -- | Ticor Title |
Source: Public Records
Mortgage History
| Date | Status | Borrower | Loan Amount |
|---|---|---|---|
| Closed | Cahill Nall Eileen W | $165,000 | |
| Closed | Cahill Eileen | $162,500 |
Source: Public Records
Tax History Compared to Growth
Tax History
| Year | Tax Paid | Tax Assessment Tax Assessment Total Assessment is a certain percentage of the fair market value that is determined by local assessors to be the total taxable value of land and additions on the property. | Land | Improvement |
|---|---|---|---|---|
| 2025 | $2,745 | $174,468 | $50,467 | $124,001 |
| 2024 | $2,671 | $171,048 | $49,478 | $121,570 |
| 2023 | $2,671 | $167,695 | $48,508 | $119,187 |
| 2022 | $2,611 | $164,407 | $47,557 | $116,850 |
| 2021 | $2,528 | $161,184 | $46,625 | $114,559 |
| 2019 | $2,463 | $156,405 | $45,243 | $111,162 |
| 2018 | $2,357 | $153,339 | $44,356 | $108,983 |
| 2017 | $2,261 | $150,334 | $43,487 | $106,847 |
| 2016 | $2,170 | $147,387 | $42,635 | $104,752 |
| 2015 | $2,114 | $145,174 | $41,995 | $103,179 |
| 2014 | $2,047 | $142,331 | $41,173 | $101,158 |
Source: Public Records
Map
Nearby Homes
- 1591 Ellis St Unit 307
- 1731 Ellis St Unit 16
- 1699 Laguna St Unit 302
- 1699 Laguna St Unit 311
- 2100 Laguna Cir Unit D
- 1600 Laguna St Unit D
- 1520 Detroit Ave
- 1867 Toyon Dr
- 1385 Galindo St
- 1771 Broadway St Unit 106
- 1771 Broadway St Unit 213
- 1851 Harrison St Unit 15
- 2722 Cowell Rd
- 2170 Fremont St
- 2093 Mount Diablo St
- 2860 Laguna St
- 1975 Bonifacio St Unit 5
- 2450 Walters Way Unit 27
- 2450 Walters Way Unit 11
- 2450 Walters Way Unit 2
- 1771 Laguna St
- 1771 Laguna St Unit 20
- 1771 Laguna St Unit 19
- 1771 Laguna St Unit 18
- 1771 Laguna St Unit 17
- 1771 Laguna St Unit 16
- 1771 Laguna St Unit 15
- 1771 Laguna St Unit 14
- 1771 Laguna St Unit 13
- 1771 Laguna St Unit 11
- 1771 Laguna St Unit 10
- 1771 Laguna St Unit 9
- 1771 Laguna St Unit 8
- 1771 Laguna St Unit 7
- 1771 Laguna St Unit 6
- 1771 Laguna St Unit 4
- 1771 Laguna St Unit 3
- 1771 Laguna St Unit 2
- 1771 Laguna St Unit 1
- 1530 Adelaide St