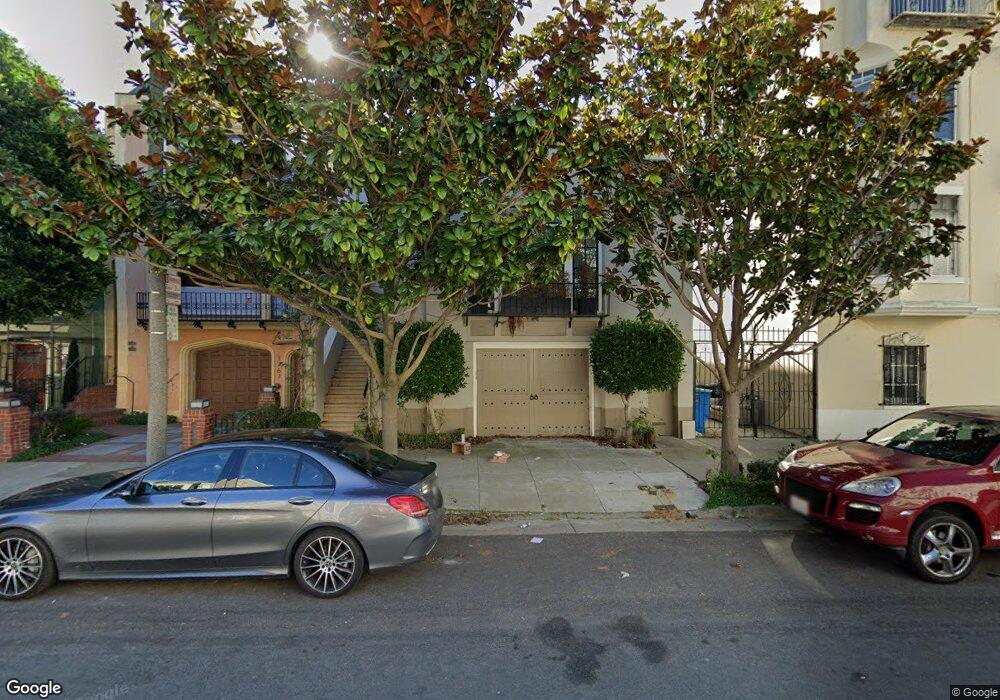
1771 N Point St San Francisco, CA 94123
Marina District NeighborhoodEstimated Value: $6,369,000 - $8,164,000
5
Beds
4
Baths
4,836
Sq Ft
$1,549/Sq Ft
Est. Value
About This Home
This home is located at 1771 N Point St, San Francisco, CA 94123 and is currently estimated at $7,489,422, approximately $1,548 per square foot. 1771 N Point St is a home located in San Francisco County with nearby schools including Sherman Elementary, Marina Middle School, and Mary L. Booker Leadership Academy.
Ownership History
Date
Name
Owned For
Owner Type
Purchase Details
Closed on
Jul 6, 2007
Sold by
1771 North Point Street Development Llc
Bought by
Briones Tamera
Current Estimated Value
Purchase Details
Closed on
Feb 27, 2006
Sold by
Demartini Richard F
Bought by
Callan Robert and Callan Barbara
Home Financials for this Owner
Home Financials are based on the most recent Mortgage that was taken out on this home.
Original Mortgage
$356,860
Interest Rate
6.18%
Mortgage Type
Credit Line Revolving
Purchase Details
Closed on
Sep 2, 1997
Sold by
Demartini Edward J and Demartini Lillian
Bought by
Demartini Edward J and Demartini Lillian
Create a Home Valuation Report for This Property
The Home Valuation Report is an in-depth analysis detailing your home's value as well as a comparison with similar homes in the area
Home Values in the Area
Average Home Value in this Area
Purchase History
| Date | Buyer | Sale Price | Title Company |
|---|---|---|---|
| Briones Tamera | -- | First American Title Co | |
| 1771 North Point Street Development Llc | $48,000 | First American Title Co | |
| Callan Robert | -- | First American Title Co | |
| Demartini Edward J | -- | -- |
Source: Public Records
Mortgage History
| Date | Status | Borrower | Loan Amount |
|---|---|---|---|
| Previous Owner | Callan Robert | $356,860 | |
| Previous Owner | Callan Robert | $1,000,000 |
Source: Public Records
Tax History Compared to Growth
Tax History
| Year | Tax Paid | Tax Assessment Tax Assessment Total Assessment is a certain percentage of the fair market value that is determined by local assessors to be the total taxable value of land and additions on the property. | Land | Improvement |
|---|---|---|---|---|
| 2025 | $73,199 | $6,304,886 | $4,413,424 | $1,891,462 |
| 2024 | $73,199 | $6,181,262 | $4,326,887 | $1,854,375 |
| 2023 | $72,135 | $6,060,062 | $4,242,047 | $1,818,015 |
| 2022 | $70,824 | $5,941,238 | $4,158,870 | $1,782,368 |
| 2021 | $70,606 | $5,824,744 | $4,077,324 | $1,747,420 |
| 2020 | $70,482 | $5,765,020 | $4,035,517 | $1,729,503 |
| 2019 | $68,278 | $5,651,982 | $3,956,390 | $1,695,592 |
| 2018 | $65,585 | $5,541,160 | $3,878,814 | $1,662,346 |
| 2017 | $65,981 | $5,432,510 | $3,802,759 | $1,629,751 |
| 2016 | $63,938 | $5,325,992 | $3,728,196 | $1,597,796 |
| 2015 | $62,885 | $5,245,992 | $3,672,196 | $1,573,796 |
| 2014 | $60,983 | $5,143,231 | $3,600,263 | $1,542,968 |
Source: Public Records
Map
Nearby Homes
- 3675 Fillmore St Unit 302
- 2724 2728 Filbert St
- 1598 Bay St Unit 104
- 25 Retiro Way
- 3460 Pierce St
- 115 Magnolia St
- 1930 Lombard St
- 1500 Francisco St Unit 1
- 3208 Pierce St Unit 406
- 1468 Francisco St Unit 1
- 3131 Pierce St Unit 406
- 3110 Buchanan St
- 1864 Greenwich St
- 3110 Octavia St
- 3219-3221 Gough St
- 32 Harris Place
- 1630 Lombard St
- 1491 Chestnut St Unit 1491
- 1601 Lombard St
- 2550 Greenwich St
- 1763 N Point St Unit 1765
- 1757 N Point St
- 3632 Fillmore St
- 1751 N Point St
- 3630 Fillmore St
- 3628 Fillmore St
- 1745 N Point St
- 1739 N Point St
- 1762 Bay St Unit 1764
- 1756 Bay St Unit 1758
- 1733 N Point St Unit 1735
- 3600 Fillmore St Unit 407
- 3600 Fillmore St Unit 409
- 3600 Fillmore St Unit 408
- 3600 Fillmore St Unit 407
- 3600 Fillmore St Unit 405
- 3600 Fillmore St Unit 404
- 3600 Fillmore St Unit 205
- 3600 Fillmore St Unit 204
- 3600 Fillmore St Unit 203