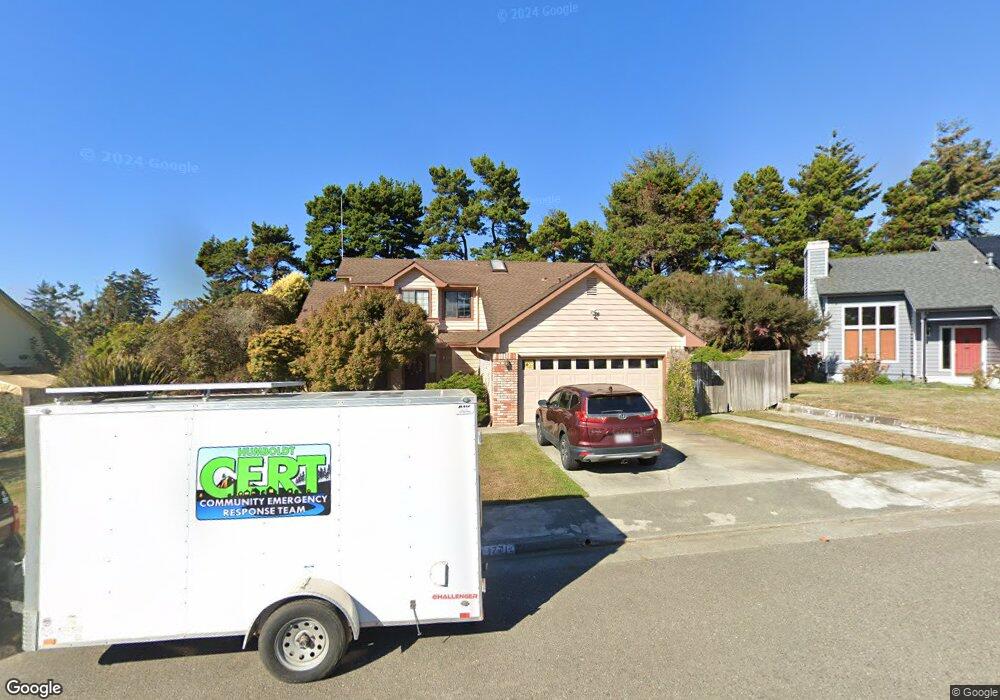
1771 Rae Ct McKinleyville, CA 95519
Estimated Value: $509,000 - $660,000
3
Beds
2
Baths
1,780
Sq Ft
$316/Sq Ft
Est. Value
About This Home
This home is located at 1771 Rae Ct, McKinleyville, CA 95519 and is currently estimated at $561,778, approximately $315 per square foot. 1771 Rae Ct is a home located in Humboldt County with nearby schools including Morris Elementary School, Dow's Prairie Elementary School, and McKinleyville Middle School.
Ownership History
Date
Name
Owned For
Owner Type
Purchase Details
Closed on
May 29, 2013
Sold by
Vancott Clifford J and Vancott Mary Grooms
Bought by
Vancott Clifford J and Vancott Mary G
Current Estimated Value
Purchase Details
Closed on
Apr 15, 2009
Sold by
Vancott Clifford J
Bought by
Vancott Clifford J and Vancott Mary Grooms
Home Financials for this Owner
Home Financials are based on the most recent Mortgage that was taken out on this home.
Original Mortgage
$116,000
Outstanding Balance
$30,061
Interest Rate
4.99%
Mortgage Type
Stand Alone Refi Refinance Of Original Loan
Estimated Equity
$531,717
Purchase Details
Closed on
Sep 2, 2003
Sold by
Kobes Maxine L
Bought by
Vancott Clifford J
Home Financials for this Owner
Home Financials are based on the most recent Mortgage that was taken out on this home.
Original Mortgage
$148,500
Interest Rate
6.4%
Mortgage Type
Purchase Money Mortgage
Create a Home Valuation Report for This Property
The Home Valuation Report is an in-depth analysis detailing your home's value as well as a comparison with similar homes in the area
Home Values in the Area
Average Home Value in this Area
Purchase History
| Date | Buyer | Sale Price | Title Company |
|---|---|---|---|
| Vancott Clifford J | -- | None Available | |
| Vancott Clifford J | -- | First American Title Company | |
| Vancott Clifford J | $300,000 | First American Title Ins Co |
Source: Public Records
Mortgage History
| Date | Status | Borrower | Loan Amount |
|---|---|---|---|
| Open | Vancott Clifford J | $116,000 | |
| Closed | Vancott Clifford J | $148,500 |
Source: Public Records
Tax History Compared to Growth
Tax History
| Year | Tax Paid | Tax Assessment Tax Assessment Total Assessment is a certain percentage of the fair market value that is determined by local assessors to be the total taxable value of land and additions on the property. | Land | Improvement |
|---|---|---|---|---|
| 2025 | $4,798 | $442,408 | $113,733 | $328,675 |
| 2024 | $4,798 | $433,734 | $111,503 | $322,231 |
| 2023 | $4,710 | $425,230 | $109,317 | $315,913 |
| 2022 | $4,732 | $416,893 | $107,174 | $309,719 |
| 2021 | $4,506 | $408,720 | $105,073 | $303,647 |
| 2020 | $4,431 | $404,530 | $103,996 | $300,534 |
| 2019 | $4,400 | $396,599 | $101,957 | $294,642 |
| 2018 | $4,227 | $388,823 | $99,958 | $288,865 |
| 2017 | $4,116 | $381,200 | $97,999 | $283,201 |
| 2016 | $4,040 | $373,727 | $96,078 | $277,649 |
| 2015 | $3,959 | $368,114 | $94,635 | $273,479 |
| 2014 | $3,896 | $360,904 | $92,782 | $268,122 |
Source: Public Records
Map
Nearby Homes
- 1982 S Gwin Rd
- 1905 Juniper Ave
- 2580 Central Ave
- 2257 Walnut Ave
- 1716 van Eaton Ave
- 1800 Sutter Rd Unit SPC 15
- Lot 19 Central Ave
- 0 Central Ave Unit 267673
- 2032 Nelson Rd
- 1819 D Ave
- 1658/1656 Ascent Place
- 2840 Little Pond St
- 1181 Chelsea Way
- 2150 Thiel Ave
- 2070 Thiel Ave
- 1090 Murray Rd
- 1541 Horrell Ave
- 1950 Norton Rd
- 1320 Brady Ct
- 1280 Creek Ct