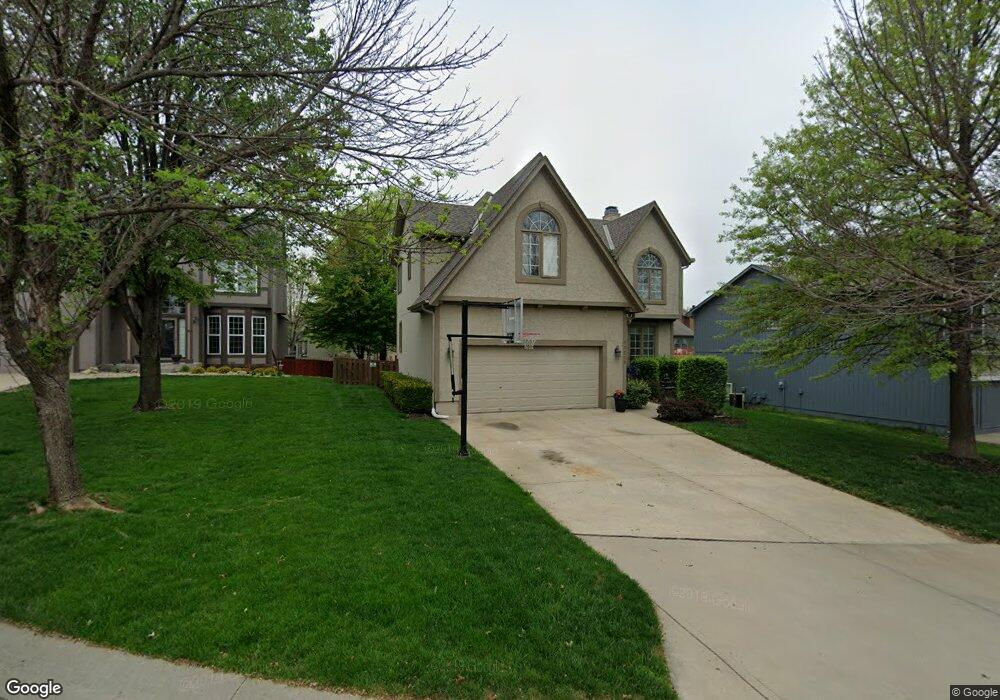
17715 W 86th St Lenexa, KS 66219
Estimated Value: $534,698 - $630,000
6
Beds
5
Baths
2,477
Sq Ft
$229/Sq Ft
Est. Value
About This Home
This home is located at 17715 W 86th St, Lenexa, KS 66219 and is currently estimated at $566,675, approximately $228 per square foot. 17715 W 86th St is a home located in Johnson County with nearby schools including Lenexa Hills Elementary School, Westridge Middle School, and Shawnee Mission West High School.
Ownership History
Date
Name
Owned For
Owner Type
Purchase Details
Closed on
Jul 9, 2021
Sold by
Lemmon Clifford L and Austin Lemmon Laurel
Bought by
Lemmon Clifford L and Austin Lemmon Laurel
Current Estimated Value
Home Financials for this Owner
Home Financials are based on the most recent Mortgage that was taken out on this home.
Original Mortgage
$217,378
Outstanding Balance
$195,283
Interest Rate
2.96%
Mortgage Type
New Conventional
Estimated Equity
$371,392
Purchase Details
Closed on
Dec 17, 2003
Sold by
Pfaff Richard A and Pfaff Donna J
Bought by
Lemmon Clifford L and Lemmon Laurel D
Home Financials for this Owner
Home Financials are based on the most recent Mortgage that was taken out on this home.
Original Mortgage
$202,000
Interest Rate
5.97%
Mortgage Type
Purchase Money Mortgage
Purchase Details
Closed on
Feb 28, 2003
Sold by
Pfaff Realty Holding Co Llc
Bought by
Pfaff Richard A and Pfaff Donna J
Create a Home Valuation Report for This Property
The Home Valuation Report is an in-depth analysis detailing your home's value as well as a comparison with similar homes in the area
Home Values in the Area
Average Home Value in this Area
Purchase History
| Date | Buyer | Sale Price | Title Company |
|---|---|---|---|
| Lemmon Clifford L | -- | Accommodation | |
| Lemmon Clifford L | -- | Chicago Title Insurance Co | |
| Pfaff Richard A | -- | Guarantee Title |
Source: Public Records
Mortgage History
| Date | Status | Borrower | Loan Amount |
|---|---|---|---|
| Open | Lemmon Clifford L | $217,378 | |
| Closed | Lemmon Clifford L | $202,000 |
Source: Public Records
Tax History
| Year | Tax Paid | Tax Assessment Tax Assessment Total Assessment is a certain percentage of the fair market value that is determined by local assessors to be the total taxable value of land and additions on the property. | Land | Improvement |
|---|---|---|---|---|
| 2025 | $5,878 | $52,532 | $10,089 | $42,443 |
| 2024 | $5,878 | $53,027 | $10,089 | $42,938 |
| 2023 | $5,755 | $51,141 | $10,089 | $41,052 |
| 2022 | $5,030 | $44,666 | $7,761 | $36,905 |
| 2021 | $4,691 | $39,571 | $7,385 | $32,186 |
| 2020 | $4,613 | $38,536 | $7,385 | $31,151 |
| 2019 | $4,589 | $38,329 | $6,158 | $32,171 |
| 2018 | $4,350 | $36,581 | $6,158 | $30,423 |
| 2017 | $4,469 | $35,868 | $6,158 | $29,710 |
| 2016 | $4,334 | $34,350 | $6,158 | $28,192 |
| 2015 | $4,280 | $34,166 | $6,158 | $28,008 |
| 2013 | -- | $28,899 | $6,158 | $22,741 |
Source: Public Records
Map
Nearby Homes
- 8554 Barstow
- 8528 Cardinal St
- 8539 Barstow
- 9317 Cottonwood Canyon Dr
- 8401 Harbinger St
- 9603 Red Oak Dr
- 19430 W 87th Ln
- 9553 Jupiter St
- 9593 Jupiter St
- 9551 Jupiter St
- 9567 Jupiter St
- 9595 Jupiter St
- 9579 Jupiter St
- 9537 Jupiter St
- 9581 Jupiter St
- 9539 Jupiter St
- 9565 Jupiter St
- 8442 Lakeview Ave
- 8954 Boehm Dr
- 9701 Jupiter St
- 17719 W 86th St
- 17711 W 86th St
- 8623 Haven St
- 17721 W 86th St
- 8619 Haven St
- 17707 W 86th St
- 17725 W 86th St
- 8627 Haven St
- 17718 W 86th St
- 17710 W 86th St
- 17714 W 86th St
- 17703 W 86th St
- 17706 W 86th St
- 8615 Haven St
- 17722 W 86th St
- 17702 W 86th St
- 17726 W 86th St
- 8631 Haven St
- 8635 Haven St
- 8600 Haven St
Your Personal Tour Guide
Ask me questions while you tour the home.