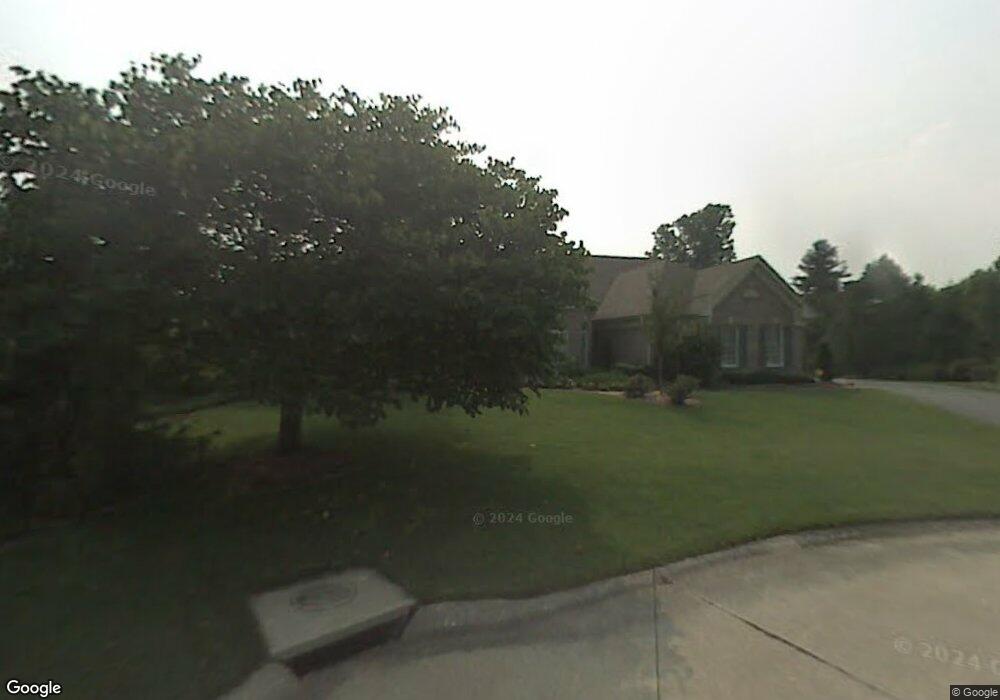
17718 Littleleaf Ct Chesterfield, MO 63005
Estimated Value: $1,017,000 - $1,127,196
5
Beds
6
Baths
4,726
Sq Ft
$225/Sq Ft
Est. Value
About This Home
This home is located at 17718 Littleleaf Ct, Chesterfield, MO 63005 and is currently estimated at $1,064,549, approximately $225 per square foot. 17718 Littleleaf Ct is a home located in St. Louis County with nearby schools including Chesterfield Elementary School, Rockwood Valley Middle School, and Lafayette High School.
Ownership History
Date
Name
Owned For
Owner Type
Purchase Details
Closed on
Mar 29, 2023
Sold by
Janice H Thake Revocable Trust
Bought by
Thake Daryl C and Thake Janice H
Current Estimated Value
Purchase Details
Closed on
Jan 12, 2010
Sold by
Thake Daryl and Thake Janice
Bought by
Thake Janice H and The Janice H Thake Revocable Trust
Purchase Details
Closed on
Dec 6, 2000
Sold by
Fobes Jon F and Layden Suanne T
Bought by
Thake Daryle and Thake Janice
Home Financials for this Owner
Home Financials are based on the most recent Mortgage that was taken out on this home.
Original Mortgage
$200,000
Interest Rate
7.13%
Purchase Details
Closed on
Jan 15, 1998
Sold by
Rutledge Michael S and Rutledge Mcdaniel T
Bought by
Fobes Jon F and Layden Suanne T
Home Financials for this Owner
Home Financials are based on the most recent Mortgage that was taken out on this home.
Original Mortgage
$214,600
Interest Rate
7.16%
Create a Home Valuation Report for This Property
The Home Valuation Report is an in-depth analysis detailing your home's value as well as a comparison with similar homes in the area
Home Values in the Area
Average Home Value in this Area
Purchase History
| Date | Buyer | Sale Price | Title Company |
|---|---|---|---|
| Thake Daryl C | -- | -- | |
| Thake Janice H | -- | None Available | |
| Thake Daryle | $627,500 | -- | |
| Thake Daryle | -- | -- | |
| Fobes Jon F | -- | -- |
Source: Public Records
Mortgage History
| Date | Status | Borrower | Loan Amount |
|---|---|---|---|
| Previous Owner | Thake Daryle | $200,000 | |
| Previous Owner | Fobes Jon F | $214,600 | |
| Closed | Fobes Jon F | $200,000 |
Source: Public Records
Tax History Compared to Growth
Tax History
| Year | Tax Paid | Tax Assessment Tax Assessment Total Assessment is a certain percentage of the fair market value that is determined by local assessors to be the total taxable value of land and additions on the property. | Land | Improvement |
|---|---|---|---|---|
| 2025 | $10,068 | $170,180 | $47,840 | $122,340 |
| 2024 | $10,068 | $141,470 | $23,940 | $117,530 |
| 2023 | $10,068 | $141,470 | $23,940 | $117,530 |
| 2022 | $9,353 | $125,460 | $24,970 | $100,490 |
| 2021 | $9,300 | $125,460 | $24,970 | $100,490 |
| 2020 | $8,822 | $114,890 | $22,190 | $92,700 |
| 2019 | $8,773 | $114,890 | $22,190 | $92,700 |
| 2018 | $9,176 | $113,340 | $19,820 | $93,520 |
| 2017 | $8,970 | $113,340 | $19,820 | $93,520 |
| 2016 | $8,554 | $103,850 | $22,190 | $81,660 |
| 2015 | $8,376 | $103,850 | $22,190 | $81,660 |
| 2014 | $9,132 | $110,270 | $25,570 | $84,700 |
Source: Public Records
Map
Nearby Homes
- 17707 Wild Horse Creek Rd
- 17702 Horse Creek Ct
- 782 Schaeffer's Grove Ct
- 718 Silver Buck Ln
- 783 Schaeffer's Grove Ct
- 724 Silver Buck Ln
- 776 Schaeffer's Grove Ct
- 744 Silver Buck Ln
- 962 Silver Buck Ln
- 805 Silver Buck Ln
- 753 Silver Buck Ln
- 1230 Wildhorse Parkway Dr
- 17609 Burnham Ct
- 1475 Country Lake Estates Dr
- 17421 Private Valley Ln
- 17411 Wild Horse Creek Rd
- 17707 Hornbean Dr
- 17283 Courtyard Mill Ln
- 17643 Wildridge Dr
- 1556 Wildhorse Parkway Dr
- 17715 Littleleaf Ct
- 17713 Sugarberry Ct
- 17710 Littleleaf Ct
- 17711 Littleleaf Ct
- 17709 Sugarberry Ct
- 17712 Blackwood Ct
- 17716 Blackwood Ct
- 17705 Sugarberry Ct
- 17706 Littleleaf Ct
- 17707 Littleleaf Ct
- 17712 Sugarberry Ct
- 17708 Blackwood Ct
- 17701 Sugarberry Ct
- 17708 Sugarberry Ct
- 17702 Littleleaf Ct
- 17703 Littleleaf Ct
- 17704 Sugarberry Ct
- 17704 Blackwood Ct
- 17717 Blackwood Ct
- 1005 Yellowwood Ct