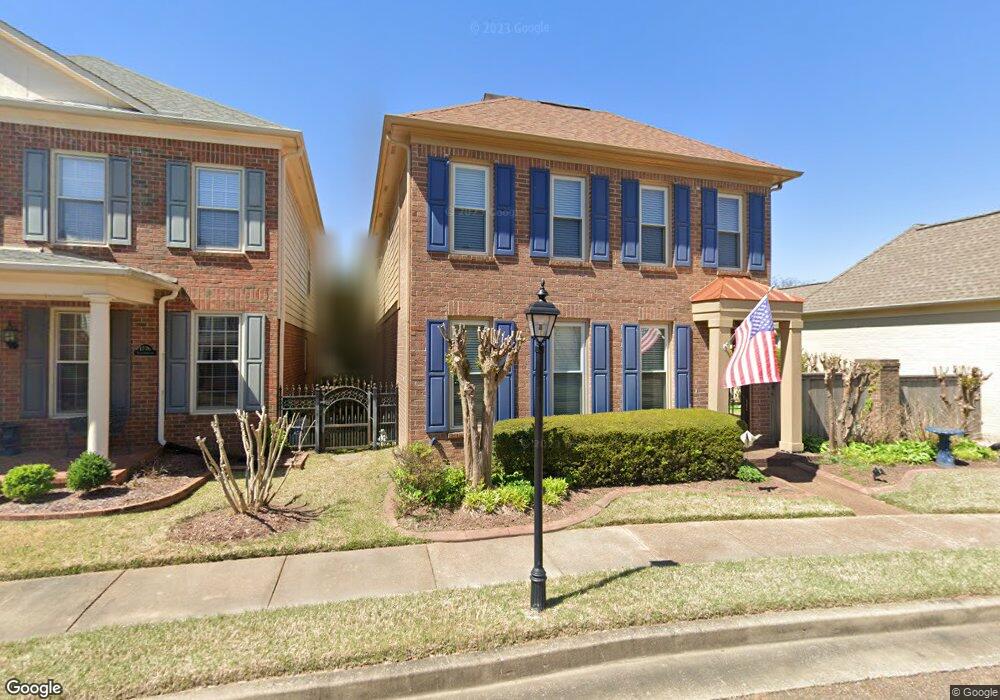
1772 Yancey Cir N Collierville, TN 38017
Estimated Value: $405,000 - $456,000
3
Beds
3
Baths
2,492
Sq Ft
$173/Sq Ft
Est. Value
About This Home
This home is located at 1772 Yancey Cir N, Collierville, TN 38017 and is currently estimated at $431,740, approximately $173 per square foot. 1772 Yancey Cir N is a home located in Shelby County with nearby schools including Bailey Station Elementary School, West Collierville Middle School, and Collierville High School.
Ownership History
Date
Name
Owned For
Owner Type
Purchase Details
Closed on
Oct 29, 2010
Sold by
Vopal Gary L
Bought by
Reed William L and Reed Mary B
Current Estimated Value
Home Financials for this Owner
Home Financials are based on the most recent Mortgage that was taken out on this home.
Original Mortgage
$210,000
Outstanding Balance
$139,330
Interest Rate
4.38%
Mortgage Type
New Conventional
Estimated Equity
$292,410
Purchase Details
Closed on
Jun 30, 2003
Sold by
Hale William H
Bought by
Vopal Gary L
Home Financials for this Owner
Home Financials are based on the most recent Mortgage that was taken out on this home.
Original Mortgage
$125,000
Interest Rate
5.2%
Mortgage Type
Balloon
Purchase Details
Closed on
Jul 30, 1996
Sold by
R & R Partners Llc
Bought by
Hale William H
Home Financials for this Owner
Home Financials are based on the most recent Mortgage that was taken out on this home.
Original Mortgage
$153,950
Interest Rate
7.5%
Create a Home Valuation Report for This Property
The Home Valuation Report is an in-depth analysis detailing your home's value as well as a comparison with similar homes in the area
Home Values in the Area
Average Home Value in this Area
Purchase History
| Date | Buyer | Sale Price | Title Company |
|---|---|---|---|
| Reed William L | $262,500 | Chicago Title | |
| Vopal Gary L | $247,000 | -- | |
| Hale William H | $177,947 | Southern Escrow Title Compan |
Source: Public Records
Mortgage History
| Date | Status | Borrower | Loan Amount |
|---|---|---|---|
| Open | Reed William L | $210,000 | |
| Previous Owner | Vopal Gary L | $125,000 | |
| Previous Owner | Hale William H | $153,950 |
Source: Public Records
Tax History Compared to Growth
Tax History
| Year | Tax Paid | Tax Assessment Tax Assessment Total Assessment is a certain percentage of the fair market value that is determined by local assessors to be the total taxable value of land and additions on the property. | Land | Improvement |
|---|---|---|---|---|
| 2025 | $2,704 | $99,200 | $20,050 | $79,150 |
| 2024 | $2,704 | $79,775 | $13,400 | $66,375 |
| 2023 | $4,172 | $79,775 | $13,400 | $66,375 |
| 2022 | $4,077 | $79,775 | $13,400 | $66,375 |
| 2021 | $4,124 | $79,775 | $13,400 | $66,375 |
| 2020 | $3,878 | $65,950 | $13,400 | $52,550 |
| 2019 | $2,671 | $65,950 | $13,400 | $52,550 |
| 2018 | $2,671 | $65,950 | $13,400 | $52,550 |
| 2017 | $2,711 | $65,950 | $13,400 | $52,550 |
| 2016 | $2,657 | $60,800 | $0 | $0 |
| 2014 | $2,657 | $60,800 | $0 | $0 |
Source: Public Records
Map
Nearby Homes
- 83 Mccall Dr
- 95 Morris Manor Dr
- 1717 Chadwick Farms Loop S
- 1723 Goldsmith Ct
- 190 Ivy Brook Ln
- 1647 Forsythe Trail
- 210 Ivy Grove Ln
- 161 E Porter Run Dr
- 10169 Gravetye Place
- 1685 Jennings Mill Ln
- 1422 Calumet Farms Dr Unit 7
- 340 Dogwood Valley Dr
- 350 Dogwood Valley Dr
- 3544 Rokeby Farm Ln
- 1664 Poppy Hills Dr
- 3545 W Taplow Way
- 3485 E Taplow Way
- 3526 Waterford Cove N
- 1139 Oak Heights Ln Unit 109
- 1543 Vireo Dr
- 1776 Yancey Cir N
- 1780 Yancey Cir N
- 1764 Yancey Cir N
- 1784 Yancey Cir N
- 1773 Yancey Cir N
- 1795 Northcross Place S
- 1791 Northcross Place S
- 1777 Yancey Cir N
- 1788 Yancey Cir N
- 1788 Yancey Cir S
- 1755 Yancey Cir N
- 1760 Yancey Cir N
- 1756 Yancey Cir N
- 1752 Yancey Cir N
- 1776 Northcross Place N
- 1794 Yancey Cir N
- 1803 Northcross Place S
- 1776 Yancey Cir S
- 1780 Yancey Cir S
- 1800 Yancey Cir N