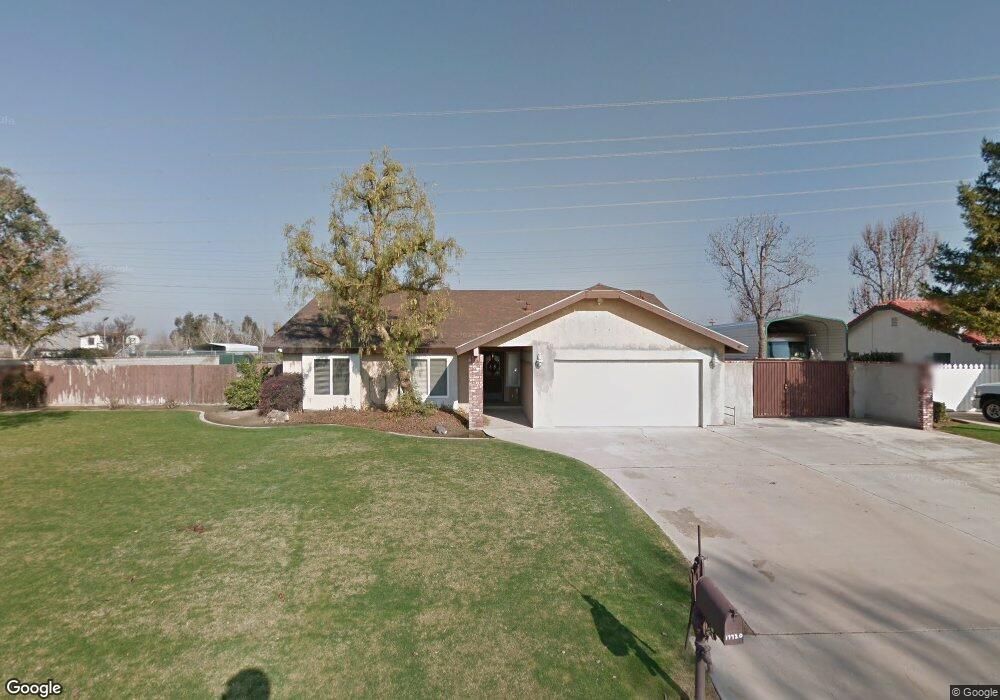
17720 Buckboard Dr Bakersfield, CA 93314
Estimated Value: $367,000 - $571,000
3
Beds
2
Baths
1,637
Sq Ft
$299/Sq Ft
Est. Value
About This Home
This home is located at 17720 Buckboard Dr, Bakersfield, CA 93314 and is currently estimated at $489,429, approximately $298 per square foot. 17720 Buckboard Dr is a home located in Kern County with nearby schools including Rio Bravo-Greeley Elementary School, Rio Bravo Elementary School, and Liberty High School.
Ownership History
Date
Name
Owned For
Owner Type
Purchase Details
Closed on
Jun 23, 2022
Sold by
Gary And Holly Cox Revocable Living Trus
Bought by
Cox Gary L
Current Estimated Value
Home Financials for this Owner
Home Financials are based on the most recent Mortgage that was taken out on this home.
Original Mortgage
$149,021
Interest Rate
5.1%
Mortgage Type
Balloon
Purchase Details
Closed on
Nov 28, 2011
Sold by
Cox Gary L and Cox Holly I
Bought by
Cox Gary L and Cox Holly I
Home Financials for this Owner
Home Financials are based on the most recent Mortgage that was taken out on this home.
Original Mortgage
$148,000
Interest Rate
4.06%
Purchase Details
Closed on
May 23, 2005
Sold by
Cox Gary Lorece and Cox Holly Idelle
Bought by
Cox Gary L and Cox Holly I
Purchase Details
Closed on
May 25, 1999
Sold by
Idelle Cox Holly
Bought by
Cox Holly Idelle
Create a Home Valuation Report for This Property
The Home Valuation Report is an in-depth analysis detailing your home's value as well as a comparison with similar homes in the area
Home Values in the Area
Average Home Value in this Area
Purchase History
| Date | Buyer | Sale Price | Title Company |
|---|---|---|---|
| Cox Gary L | -- | New Title Company Name | |
| Cox Gary L | -- | Placer Title Company | |
| Cox Gary L | -- | Placer Title Company | |
| Cox Gary L | -- | -- | |
| Cox Holly Idelle | -- | Chicago Title Co |
Source: Public Records
Mortgage History
| Date | Status | Borrower | Loan Amount |
|---|---|---|---|
| Previous Owner | Cox Gary L | $149,021 | |
| Previous Owner | Cox Gary L | $148,000 |
Source: Public Records
Tax History Compared to Growth
Tax History
| Year | Tax Paid | Tax Assessment Tax Assessment Total Assessment is a certain percentage of the fair market value that is determined by local assessors to be the total taxable value of land and additions on the property. | Land | Improvement |
|---|---|---|---|---|
| 2025 | $2,703 | $182,762 | $44,657 | $138,105 |
| 2024 | $2,639 | $179,180 | $43,782 | $135,398 |
| 2023 | $2,639 | $175,668 | $42,924 | $132,744 |
| 2022 | $2,609 | $172,225 | $42,083 | $130,142 |
| 2021 | $2,514 | $168,849 | $41,258 | $127,591 |
| 2020 | $2,423 | $167,118 | $40,835 | $126,283 |
| 2019 | $2,368 | $167,118 | $40,835 | $126,283 |
| 2018 | $2,269 | $160,630 | $39,250 | $121,380 |
| 2017 | $2,222 | $157,481 | $38,481 | $119,000 |
| 2016 | $1,867 | $154,394 | $37,727 | $116,667 |
| 2015 | $1,806 | $152,076 | $37,161 | $114,915 |
| 2014 | $1,771 | $149,098 | $36,434 | $112,664 |
Source: Public Records
Map
Nearby Homes
- 3139 Nord Ave
- 16741 Pinecrest Ct
- 16716 Brookview Ct
- 16617 Stone Mill Ct
- 3128 Cavalcade Way
- 16725 Bellewood Place
- 17343 Havenridge Dr
- 17340 Legend Oaks Ln
- 17633 Legend Oaks Ln
- 19240 Schweikart Ave
- 16612 Bellewood Place
- 2522 Greeley Rd
- 0 W Judd Unit 202500058
- 0 Sullivan Unit 202312452
- 0 Bussell Rd Unit 202505473
- 0 Tiata Ave Unit 202506554
- 0 Noble Unit 202502617
- 0 Noble Unit 202505471
- 0 Gatson St Unit 202512397
- 0 Hageman Rd Unit 202500978
- 17700 Buckboard Dr
- 17740 Buckboard Dr
- 2600 Carriage St
- 2820 Carriage St
- 17800 Buckboard Dr
- 2821 Carriage St
- 2804 Carriage St
- 3011 Nord Ave
- 2801 Carriage St
- 17820 Buckboard Dr
- 2740 Carriage St
- 3027 Nord Ave
- 2741 Carriage St
- 2654 Nord Ave
- 17840 Buckboard Dr
- 2720 Carriage St
- 2721 Carriage St
- 17900 Buckboard Dr
- 2700 Carriage St
- 3016 Nord Ave