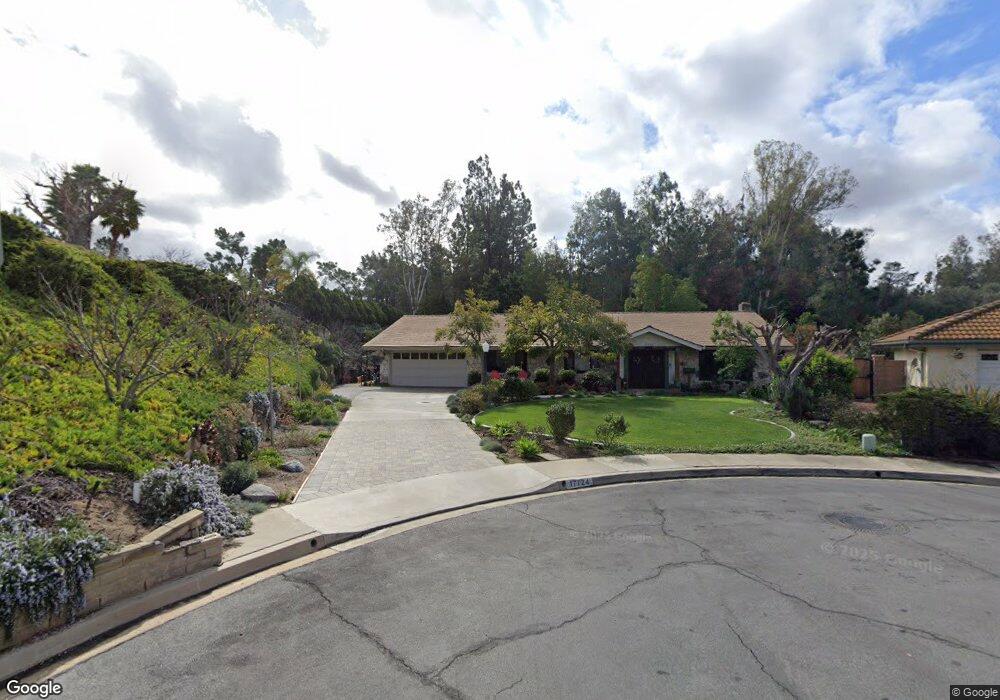
17724 Via Gracia San Diego, CA 92128
Rancho Bernardo NeighborhoodEstimated Value: $1,264,000 - $1,648,000
3
Beds
2
Baths
1,950
Sq Ft
$742/Sq Ft
Est. Value
About This Home
This home is located at 17724 Via Gracia, San Diego, CA 92128 and is currently estimated at $1,446,151, approximately $741 per square foot. 17724 Via Gracia is a home located in San Diego County with nearby schools including Chaparral Elementary, Bernardo Heights Middle, and Rancho Bernardo High.
Ownership History
Date
Name
Owned For
Owner Type
Purchase Details
Closed on
Sep 2, 2020
Sold by
Fries Erich and Fries Jennifer
Bought by
Fries Erich and Fries Jennifer
Current Estimated Value
Home Financials for this Owner
Home Financials are based on the most recent Mortgage that was taken out on this home.
Original Mortgage
$227,300
Outstanding Balance
$182,165
Interest Rate
2.9%
Mortgage Type
New Conventional
Estimated Equity
$1,263,986
Purchase Details
Closed on
Jul 3, 2019
Sold by
Fries Erich Raymond and Fries Jennifer Ann
Bought by
Fries Erich and Fries Jennifer
Purchase Details
Closed on
Feb 24, 1998
Sold by
Jacqueline Pritchard
Bought by
Fries Erich Raymond and Fries Jennifer Ann
Home Financials for this Owner
Home Financials are based on the most recent Mortgage that was taken out on this home.
Original Mortgage
$256,500
Interest Rate
7.18%
Create a Home Valuation Report for This Property
The Home Valuation Report is an in-depth analysis detailing your home's value as well as a comparison with similar homes in the area
Home Values in the Area
Average Home Value in this Area
Purchase History
| Date | Buyer | Sale Price | Title Company |
|---|---|---|---|
| Fries Erich | -- | None Available | |
| Fries Erich | -- | None Available | |
| Fries Erich Raymond | $285,000 | Commonwealth Land Title Co |
Source: Public Records
Mortgage History
| Date | Status | Borrower | Loan Amount |
|---|---|---|---|
| Open | Fries Erich | $227,300 | |
| Previous Owner | Fries Erich Raymond | $256,500 |
Source: Public Records
Tax History Compared to Growth
Tax History
| Year | Tax Paid | Tax Assessment Tax Assessment Total Assessment is a certain percentage of the fair market value that is determined by local assessors to be the total taxable value of land and additions on the property. | Land | Improvement |
|---|---|---|---|---|
| 2025 | $5,502 | $500,549 | $219,418 | $281,131 |
| 2024 | $5,502 | $490,735 | $215,116 | $275,619 |
| 2023 | $5,383 | $481,114 | $210,899 | $270,215 |
| 2022 | $5,292 | $471,681 | $206,764 | $264,917 |
| 2021 | $5,222 | $462,433 | $202,710 | $259,723 |
| 2020 | $5,151 | $457,692 | $200,632 | $257,060 |
| 2019 | $5,017 | $448,719 | $196,699 | $252,020 |
| 2018 | $4,875 | $439,922 | $192,843 | $247,079 |
| 2017 | $83 | $431,297 | $189,062 | $242,235 |
| 2016 | $4,645 | $422,841 | $185,355 | $237,486 |
| 2015 | $4,575 | $416,490 | $182,571 | $233,919 |
| 2014 | $4,467 | $408,332 | $178,995 | $229,337 |
Source: Public Records
Map
Nearby Homes
- 12022 Versailles Ct
- 17617 Pomerado Rd Unit 213
- 11915 Fairhope Rd
- 12505 Oaks Dr N Unit 141
- 12575 Oaks Dr N Unit 220
- 17975 Caminito Pinero Unit 293
- 17865 Caminito Pinero Unit 251
- 17925 Caminito Pinero Unit 270
- 17885 Caminito Pinero Unit 255
- 12516 Camino Vuelo
- 12565 Oaks North Dr Unit 115
- 12580 Oaks North Dr Unit 12
- 11820 Caminito Ronaldo Unit 222
- 11855 Caminito Ronaldo Unit 108
- 17461 Plaza Abierto Unit 22
- 17473 Plaza Abierto Unit 30
- 12031 Caminito Cadena
- 14320 Savannah Ct
- 14344 Savannah Ct
- 14342 Savannah Ct
- 17736 Via Gracia
- 17748 Sintonte Dr
- 17736 Sintonte Dr
- 17726 Sintonte Dr
- 17748 Via Gracia
- 17768 Sintonte Dr
- 17734 Via Alta Mirasol
- 17760 Via Gracia
- 17747 Sintonte Dr
- 17785 Sintonte Dr
- 17780 Sintonte Dr
- 17729 Sintonte Dr
- 17772 Via Gracia
- 17796 Sintonte Dr
- 17746 Via Alta Mirasol
- 12215 Sintonte Ct
- 17758 Via Alta Mirasol
- 17784 Via Gracia
- 17808 Sintonte Dr
- 12223 Sintonte Ct Unit 16