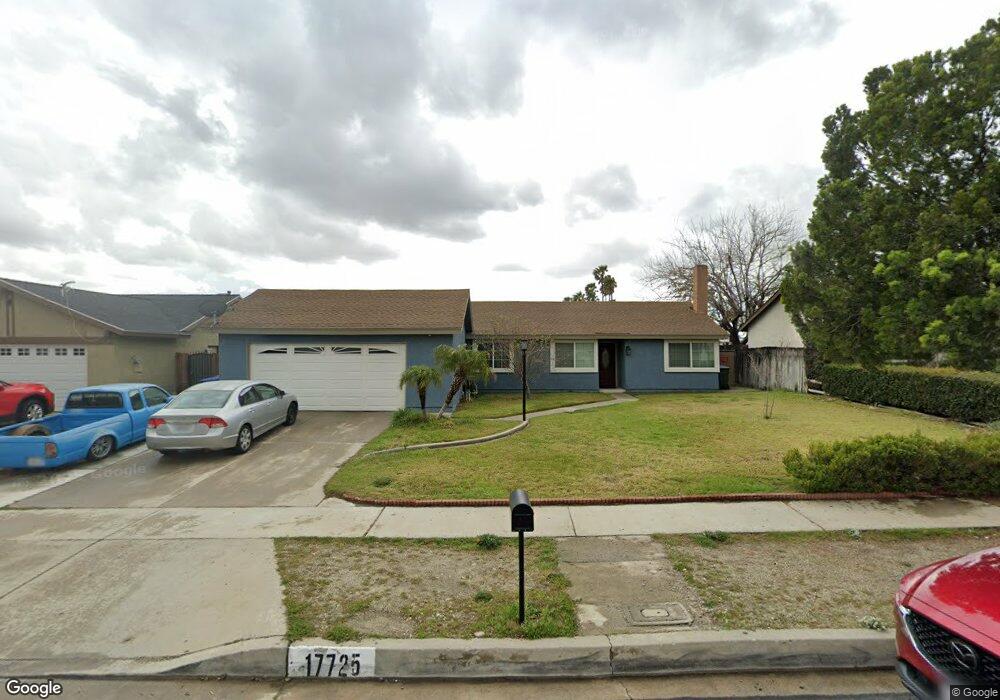
17725 Shamrock Ave Fontana, CA 92336
Estimated Value: $557,292 - $608,000
3
Beds
2
Baths
1,443
Sq Ft
$410/Sq Ft
Est. Value
About This Home
This home is located at 17725 Shamrock Ave, Fontana, CA 92336 and is currently estimated at $591,323, approximately $409 per square foot. 17725 Shamrock Ave is a home located in San Bernardino County with nearby schools including Locust Elementary School, Alder Middle School, and Fontana A. B. Miller High School.
Ownership History
Date
Name
Owned For
Owner Type
Purchase Details
Closed on
Oct 4, 2021
Sold by
Moreno Reuben John and Harlev Yvonne Chrystal
Bought by
Moreno Reuben John and Harlev Yvonne Chrystal
Current Estimated Value
Purchase Details
Closed on
Aug 24, 2020
Sold by
Harlev Mathew James
Bought by
Harlev Yvonne Chrystal
Home Financials for this Owner
Home Financials are based on the most recent Mortgage that was taken out on this home.
Original Mortgage
$271,000
Interest Rate
2.9%
Mortgage Type
New Conventional
Purchase Details
Closed on
Jul 31, 2020
Sold by
Moreno Reuben John
Bought by
Moreno Reuben John and Harlev Yvonne Chrystal
Home Financials for this Owner
Home Financials are based on the most recent Mortgage that was taken out on this home.
Original Mortgage
$271,000
Interest Rate
2.9%
Mortgage Type
New Conventional
Create a Home Valuation Report for This Property
The Home Valuation Report is an in-depth analysis detailing your home's value as well as a comparison with similar homes in the area
Home Values in the Area
Average Home Value in this Area
Purchase History
| Date | Buyer | Sale Price | Title Company |
|---|---|---|---|
| Moreno Reuben John | -- | None Available | |
| Harlev Yvonne Chrystal | -- | Corinthian Title Company | |
| Moreno Reuben John | -- | Corinthian Title Company |
Source: Public Records
Mortgage History
| Date | Status | Borrower | Loan Amount |
|---|---|---|---|
| Closed | Harlev Yvonne Chrystal | $271,000 |
Source: Public Records
Tax History Compared to Growth
Tax History
| Year | Tax Paid | Tax Assessment Tax Assessment Total Assessment is a certain percentage of the fair market value that is determined by local assessors to be the total taxable value of land and additions on the property. | Land | Improvement |
|---|---|---|---|---|
| 2025 | $2,335 | $189,489 | $30,066 | $159,423 |
| 2024 | $2,335 | $185,773 | $29,476 | $156,297 |
| 2023 | $1,850 | $182,130 | $28,898 | $153,232 |
| 2022 | $1,841 | $178,558 | $28,331 | $150,227 |
| 2021 | $1,817 | $175,056 | $27,775 | $147,281 |
| 2020 | $1,812 | $173,261 | $27,490 | $145,771 |
| 2019 | $1,755 | $169,864 | $26,951 | $142,913 |
| 2018 | $1,781 | $166,534 | $26,423 | $140,111 |
| 2017 | $1,769 | $163,269 | $25,905 | $137,364 |
| 2016 | $1,738 | $160,068 | $25,397 | $134,671 |
| 2015 | $1,715 | $157,664 | $25,016 | $132,648 |
| 2014 | $1,714 | $154,576 | $24,526 | $130,050 |
Source: Public Records
Map
Nearby Homes
- 17571 Shamrock Ave
- 7740 Lombardy Ave
- 17806 Terry St
- 7724 Myles Ct
- 17548 Court St
- 7835 Laurel Ave
- 17562 Court St
- 7936 Alder Ave
- 7852 Grace Ave
- 7738 Encinitas Ave
- 17341 Fairfax St
- 7470 Blanchard Ave
- 17279 Miller Ave
- 17181 Wabash Ave
- 18281 Montgomery Ave
- 8019 Alder Ave
- 7398 N Maple Ave
- 7760 Blanchard Ave
- 17848 17858 Foothill Blvd
- 7159 Kempster Ave
- 17735 Shamrock Ave
- 17715 Shamrock Ave
- 17745 Shamrock Ave
- 17705 Shamrock Ave
- 17720 Shamrock Ave
- 17710 Shamrock Ave
- 17740 Shamrock Ave
- 17755 Shamrock Ave
- 17700 Shamrock Ave
- 7400 Evergreen Ave
- 17750 Shamrock Ave
- 7405 Alder Ave
- 17765 Shamrock Ave
- 17745 Montgomery Ct
- 7390 Evergreen Ave
- 7444 Alder Ave
- 7454 Alder Ave
- 17760 Shamrock Ave
- 17755 Montgomery Ct
- 7434 Alder Ave