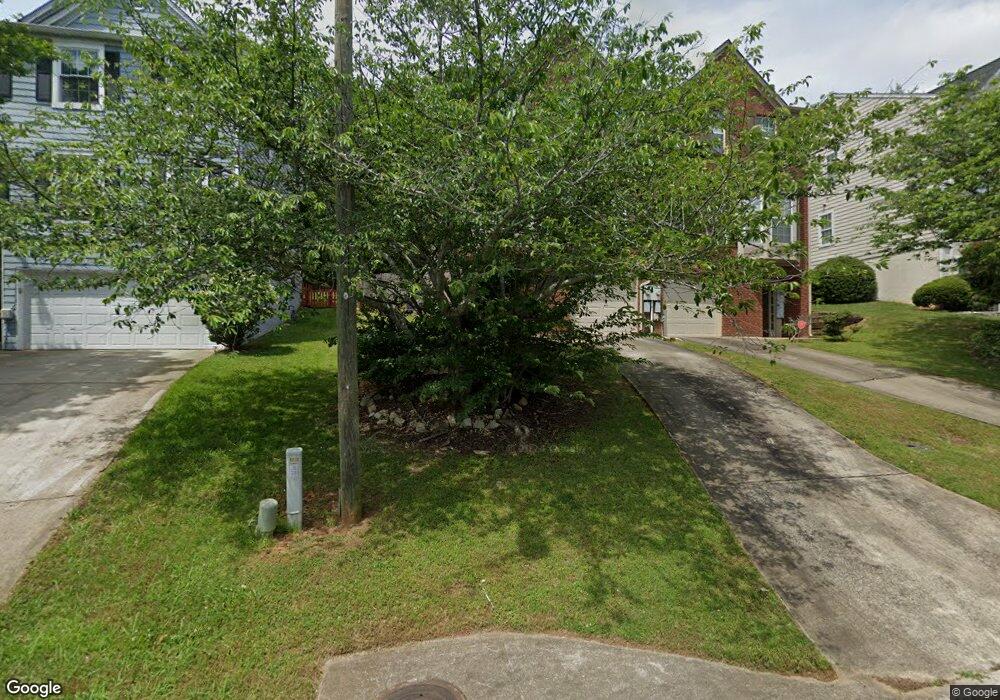
1773 Barrington Overlook Unit 4 Marietta, GA 30066
Estimated Value: $259,000 - $303,000
3
Beds
3
Baths
1,464
Sq Ft
$197/Sq Ft
Est. Value
About This Home
This home is located at 1773 Barrington Overlook Unit 4, Marietta, GA 30066 and is currently estimated at $288,452, approximately $197 per square foot. 1773 Barrington Overlook Unit 4 is a home located in Cobb County with nearby schools including Sawyer Road Elementary School, Marietta Sixth Grade Academy, and Marietta Middle School.
Ownership History
Date
Name
Owned For
Owner Type
Purchase Details
Closed on
Mar 5, 2022
Sold by
Calhoun Tonya R
Bought by
Calhoun Tonya R and Calhoun Alzay F
Current Estimated Value
Home Financials for this Owner
Home Financials are based on the most recent Mortgage that was taken out on this home.
Original Mortgage
$121,800
Outstanding Balance
$113,800
Interest Rate
3.92%
Mortgage Type
New Conventional
Estimated Equity
$174,652
Purchase Details
Closed on
Nov 3, 1999
Sold by
Dornellas Scott D
Bought by
Robinson Melanie D
Home Financials for this Owner
Home Financials are based on the most recent Mortgage that was taken out on this home.
Original Mortgage
$113,650
Interest Rate
7.7%
Mortgage Type
FHA
Purchase Details
Closed on
May 27, 1997
Sold by
Homeland Comm Inc
Bought by
Dornellas Scott D
Home Financials for this Owner
Home Financials are based on the most recent Mortgage that was taken out on this home.
Original Mortgage
$94,384
Interest Rate
8.13%
Mortgage Type
FHA
Create a Home Valuation Report for This Property
The Home Valuation Report is an in-depth analysis detailing your home's value as well as a comparison with similar homes in the area
Home Values in the Area
Average Home Value in this Area
Purchase History
| Date | Buyer | Sale Price | Title Company |
|---|---|---|---|
| Calhoun Tonya R | -- | Title365 | |
| Robinson Melanie D | $115,200 | -- | |
| Dornellas Scott D | $94,800 | -- |
Source: Public Records
Mortgage History
| Date | Status | Borrower | Loan Amount |
|---|---|---|---|
| Open | Calhoun Tonya R | $121,800 | |
| Previous Owner | Robinson Melanie D | $113,650 | |
| Previous Owner | Dornellas Scott D | $94,384 |
Source: Public Records
Tax History Compared to Growth
Tax History
| Year | Tax Paid | Tax Assessment Tax Assessment Total Assessment is a certain percentage of the fair market value that is determined by local assessors to be the total taxable value of land and additions on the property. | Land | Improvement |
|---|---|---|---|---|
| 2024 | $989 | $116,856 | $34,000 | $82,856 |
| 2023 | $842 | $99,520 | $30,000 | $69,520 |
| 2022 | $318 | $75,028 | $16,000 | $59,028 |
| 2021 | $327 | $75,028 | $16,000 | $59,028 |
| 2020 | $327 | $71,392 | $14,000 | $57,392 |
| 2019 | $326 | $60,020 | $12,000 | $48,020 |
| 2018 | $326 | $60,020 | $12,000 | $48,020 |
| 2017 | $261 | $51,808 | $8,000 | $43,808 |
| 2016 | $153 | $31,888 | $4,800 | $27,088 |
| 2015 | $168 | $31,888 | $4,800 | $27,088 |
| 2014 | $118 | $24,696 | $0 | $0 |
Source: Public Records
Map
Nearby Homes
- 61 Barrington Place
- 126 Bridge View Dr
- 1385 Vayda Ct
- 515 Harbor Lake Ct
- 1359 Vayda Ct
- 1932 Ferry Dr
- 1550 Bells Ferry Rd
- 141 Dickson Rd
- 1713 Lancaster Dr
- 1520 Bells Ferry Rd
- 1510 Bells Ferry Rd
- 40 Dickson Rd
- 2018 Darrell Dr
- Shelby Plan at GreenHouse - Wisteria at GreenHouse
- Tucker II Plan at GreenHouse - Wisteria at GreenHouse
- Canton II Plan at GreenHouse - Wisteria at GreenHouse
- Riverside Plan at GreenHouse - Wisteria at GreenHouse
- Emerson Plan at GreenHouse - Wisteria at GreenHouse
- Englewood Plan at GreenHouse - Gatherings® at GreenHouse
- Brookwood Plan at GreenHouse - Gatherings® at GreenHouse
- 1775 Barrington Overlook Unit 4
- 1765 Barrington Oval
- 1765 Barrington Cir
- 1765 Barrington Overlook Unit 1765
- 1765 Barrington Overlook Unit 4
- 1765 Barrington Overlook
- 1763 Barrington Overlook Unit 4
- 1783 Barrington Overlook Unit 3
- 1785 Barrington Overlook
- 1755 Barrington Overlook
- 1793 Barrington Overlook
- 1793 Barrington Overlook Unit 3
- 1753 Barrington Overlook Unit 1753
- 1753 Barrington Overlook
- 1753 Barrington Overlook Unit 4
- 42 Barrington Place Unit 3
- 1776 Barrington Overlook
- 1795 Barrington Overlook
- 1774 Barrington Overlook Unit 1774
- 1774 Barrington Overlook