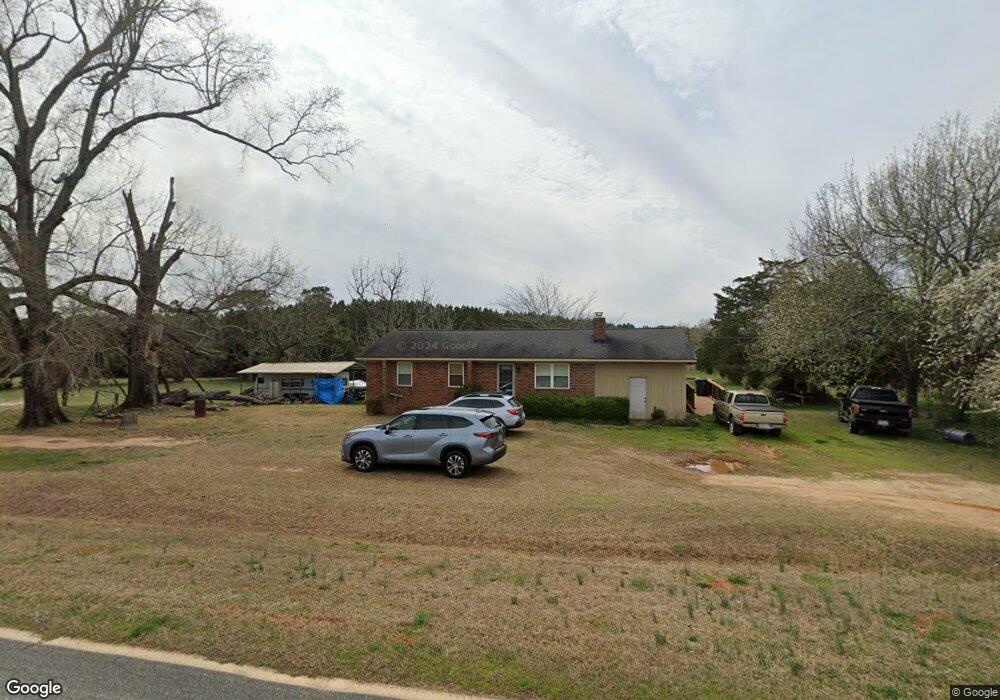
1773 Lewis Crook Rd Lincolnton, GA 30817
Estimated Value: $164,578 - $203,000
3
Beds
2
Baths
1,710
Sq Ft
$104/Sq Ft
Est. Value
About This Home
This home is located at 1773 Lewis Crook Rd, Lincolnton, GA 30817 and is currently estimated at $177,645, approximately $103 per square foot. 1773 Lewis Crook Rd is a home located in Lincoln County with nearby schools including Lincoln County Elementary School, Lincoln County Middle School, and Lincoln County High School.
Ownership History
Date
Name
Owned For
Owner Type
Purchase Details
Closed on
Aug 7, 2003
Sold by
Curry Elah and Curry Gloria
Bought by
Starbuck Brenda G
Current Estimated Value
Purchase Details
Closed on
May 26, 1999
Sold by
Curry Elah
Bought by
Curry Elah and Curry Gloria
Purchase Details
Closed on
Oct 9, 1996
Sold by
Curry Elah and Curry Hannah K
Bought by
Curry Elah
Purchase Details
Closed on
May 26, 1992
Sold by
Pullum David E and Pullum Deborah F
Bought by
Curry Elah and Curry Hannah K
Purchase Details
Closed on
Jul 22, 1986
Sold by
Fulton Federal Savings & Loan
Bought by
Pullum David E and Pullum Deborah F
Purchase Details
Closed on
Jul 1, 1986
Sold by
Smalley Kenneth and Smalley Kathy I
Bought by
Fulton Federa & L Savings & Loan
Purchase Details
Closed on
Nov 2, 1976
Sold by
Smalley Kenneth
Bought by
Smalley Kenneth and Smalley Kathy I
Purchase Details
Closed on
Jul 10, 1976
Sold by
Mckinney H C
Bought by
Smalley Kenneth
Create a Home Valuation Report for This Property
The Home Valuation Report is an in-depth analysis detailing your home's value as well as a comparison with similar homes in the area
Home Values in the Area
Average Home Value in this Area
Purchase History
| Date | Buyer | Sale Price | Title Company |
|---|---|---|---|
| Starbuck Brenda G | $73,000 | -- | |
| Curry Elah | -- | -- | |
| Curry Elah | -- | -- | |
| Curry Elah | $57,000 | -- | |
| Pullum David E | $30,000 | -- | |
| Fulton Federa & L Savings & Loan | -- | -- | |
| Smalley Kenneth | -- | -- | |
| Smalley Kenneth | $1,300 | -- |
Source: Public Records
Tax History Compared to Growth
Tax History
| Year | Tax Paid | Tax Assessment Tax Assessment Total Assessment is a certain percentage of the fair market value that is determined by local assessors to be the total taxable value of land and additions on the property. | Land | Improvement |
|---|---|---|---|---|
| 2025 | $1,325 | $45,276 | $3,240 | $42,036 |
| 2024 | $1,266 | $41,436 | $3,080 | $38,356 |
| 2023 | $691 | $36,024 | $2,440 | $33,584 |
| 2022 | $1,039 | $34,624 | $2,440 | $32,184 |
| 2021 | $1,034 | $31,356 | $2,120 | $29,236 |
| 2020 | $968 | $25,156 | $2,120 | $23,036 |
| 2019 | $971 | $25,156 | $2,120 | $23,036 |
| 2018 | $791 | $25,156 | $2,120 | $23,036 |
| 2017 | $967 | $30,760 | $3,280 | $27,480 |
| 2016 | $1,080 | $30,760 | $3,280 | $27,480 |
| 2015 | -- | $30,446 | $3,280 | $27,166 |
| 2014 | -- | $30,446 | $3,280 | $27,166 |
| 2013 | -- | $30,446 | $3,280 | $27,166 |
Source: Public Records
Map
Nearby Homes
- 0 Georgia 220 Unit TRACT B 10468309
- 0 Georgia 220 Unit TRACT A 10468318
- 000 Georgia 220
- 0 Crook Rd Unit 10643680
- 1987 Crook Rd
- 0 Hwy 220 Tract A
- 0 Ga-220 Unit 541923
- 0 C E Norman Rd Unit 10612648
- C E Norman Rd
- Na Metasville Rd
- 1460 Leathersville Rd
- 168 Watson Street Extension
- 280 May Ave
- 0 Watson St
- 00 Crook Rd
- 168 Ext Watson St
- Lot 32 Eagle Point
- 118 Humphrey St
- 570 Wallace-Wells Cir
- 00 C E Norman Rd
- 1717 Lewis Crook Rd
- 1686 Lewis Crook Rd
- 1084 Bryant Rd
- 1059 Bryant Rd
- 1586 Lewis Crook Rd
- 1940 Lewis Crook Rd
- 1035 Bryant Rd
- 1576 Lewis Crook Rd
- 1880 Washington Hwy
- 2004 Washington Hwy
- 1822 Washington Hwy
- 0 Lewis Crook Rd Unit 454674
- 0 Lewis Crook Rd
- 1540 Lewis Crook Rd
- (4860) Georgia 220
- 4509 09 Georgia 220
- 45.09 Georgia 220
- 1718 Washington Hwy
- 1849 Washington Hwy
- 2172 Washington Hwy