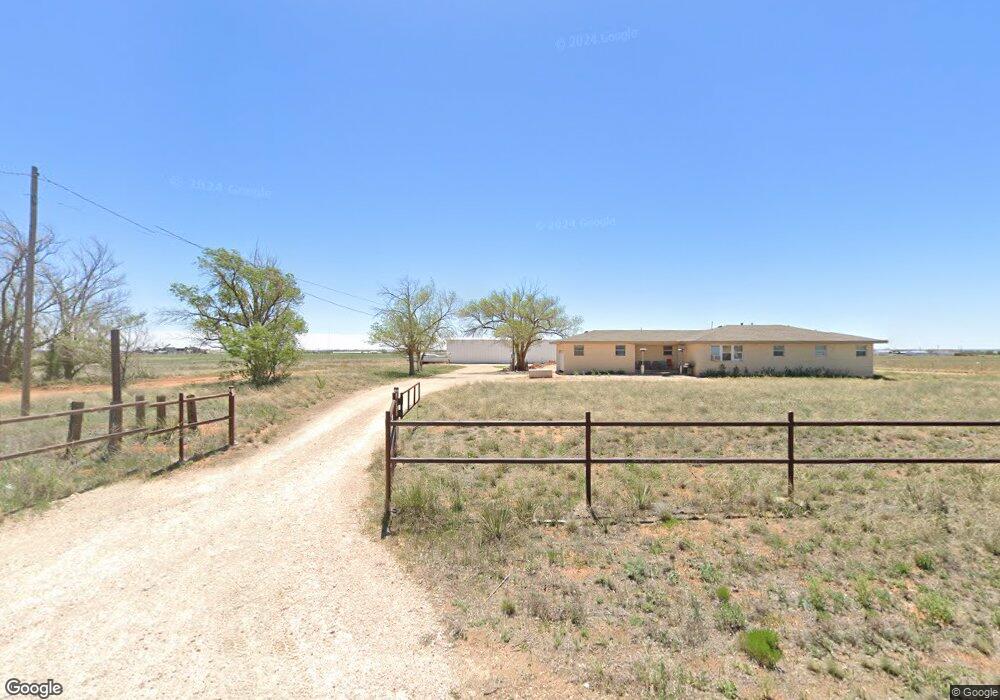
1773 S Roosevelt Road 3 Portales, NM 88130
Estimated Value: $241,000 - $259,774
3
Beds
2
Baths
1,894
Sq Ft
$130/Sq Ft
Est. Value
About This Home
This home is located at 1773 S Roosevelt Road 3, Portales, NM 88130 and is currently estimated at $246,944, approximately $130 per square foot. 1773 S Roosevelt Road 3 is a home located in Roosevelt County with nearby schools including Brown Early Childhood Center, Valencia Elementary School, and James Elementary School.
Ownership History
Date
Name
Owned For
Owner Type
Purchase Details
Closed on
May 11, 2021
Sold by
Arthur Don
Bought by
Flanagan Michael A and Flanagan Tabitha M
Current Estimated Value
Home Financials for this Owner
Home Financials are based on the most recent Mortgage that was taken out on this home.
Original Mortgage
$187,200
Outstanding Balance
$155,209
Interest Rate
3.1%
Mortgage Type
New Conventional
Estimated Equity
$91,735
Purchase Details
Closed on
Sep 3, 2015
Sold by
Nixon Bruce
Bought by
Arthur Don
Home Financials for this Owner
Home Financials are based on the most recent Mortgage that was taken out on this home.
Original Mortgage
$128,000
Interest Rate
4.08%
Mortgage Type
New Conventional
Purchase Details
Closed on
Aug 7, 2008
Sold by
Hobbs Dora
Bought by
Dresie Frances Louise and Braun Doralene
Create a Home Valuation Report for This Property
The Home Valuation Report is an in-depth analysis detailing your home's value as well as a comparison with similar homes in the area
Home Values in the Area
Average Home Value in this Area
Purchase History
| Date | Buyer | Sale Price | Title Company |
|---|---|---|---|
| Flanagan Michael A | -- | Landmark Title | |
| Arthur Don | -- | Aztec Abstract & Title Ins C | |
| Dresie Frances Louise | -- | Graham Title Company |
Source: Public Records
Mortgage History
| Date | Status | Borrower | Loan Amount |
|---|---|---|---|
| Open | Flanagan Michael A | $187,200 | |
| Previous Owner | Arthur Don | $128,000 |
Source: Public Records
Tax History Compared to Growth
Tax History
| Year | Tax Paid | Tax Assessment Tax Assessment Total Assessment is a certain percentage of the fair market value that is determined by local assessors to be the total taxable value of land and additions on the property. | Land | Improvement |
|---|---|---|---|---|
| 2025 | $1,408 | $67,259 | $8,791 | $58,468 |
| 2024 | $1,408 | $64,350 | $8,791 | $55,559 |
| 2023 | $1,408 | $63,211 | $8,791 | $54,420 |
| 2022 | $1,296 | $58,662 | $8,791 | $49,871 |
| 2021 | $990 | $44,680 | $8,191 | $36,489 |
| 2020 | $992 | $44,680 | $8,191 | $36,489 |
| 2019 | $992 | $44,680 | $8,191 | $36,489 |
| 2018 | $677 | $30,895 | $8,191 | $22,704 |
| 2017 | $677 | $30,895 | $8,191 | $22,704 |
| 2016 | $683 | $30,895 | $8,191 | $22,704 |
| 2015 | $414 | $19,226 | $3,547 | $15,679 |
| 2011 | -- | $0 | $0 | $0 |
Source: Public Records
Map
Nearby Homes
- 128 Crest Pointe Dr
- 000 Crest Pointe
- 103 Crest Pointe Dr St
- 71 Nm 467
- 348 S Roosevelt Road R 1 2
- 0 New Mexico 467
- 200 E Quince St
- 351 S Roosevelt Rd S
- 1905 Westview Diamond Way
- 908 E Elbe St
- 754 S Roosevelt Road Q
- 413 N Main Ave
- 1123 N Main Ave
- 900 E Danube St
- 1914 New Mexico 236
- 832 E Canadian St
- 1120 N J Ave
- 000 E Amazon St
- 339 S Roosevelt Road P
- 124 N Globe Ave
- 1788 S Roosevelt Road 3
- 1790 S Roosevelt Road 3
- 1760 S Roosevelt Road 3
- 1774 S Roosevelt Road 3
- 289 S Roosevelt Road R
- 1792 S Rr 3
- 1754 S Roosevelt Road 3
- 1754 Rr 3
- 1794 S Roosevelt Road 3
- 1794 S Roosevelt Road 3 Unit 901
- 1796 S Roosevelt Road 3
- 309 S Rr R
- 289 S Rr R
- 128 Crest Point Dr
- 130 Crest Pointe Dr
- 1746 S Roosevelt Road 3
- 134 Crest Point Dr
- 287 S Roosevelt Road R
- 134 Crest Pointe Dr
- 321 S Roosevelt Road R