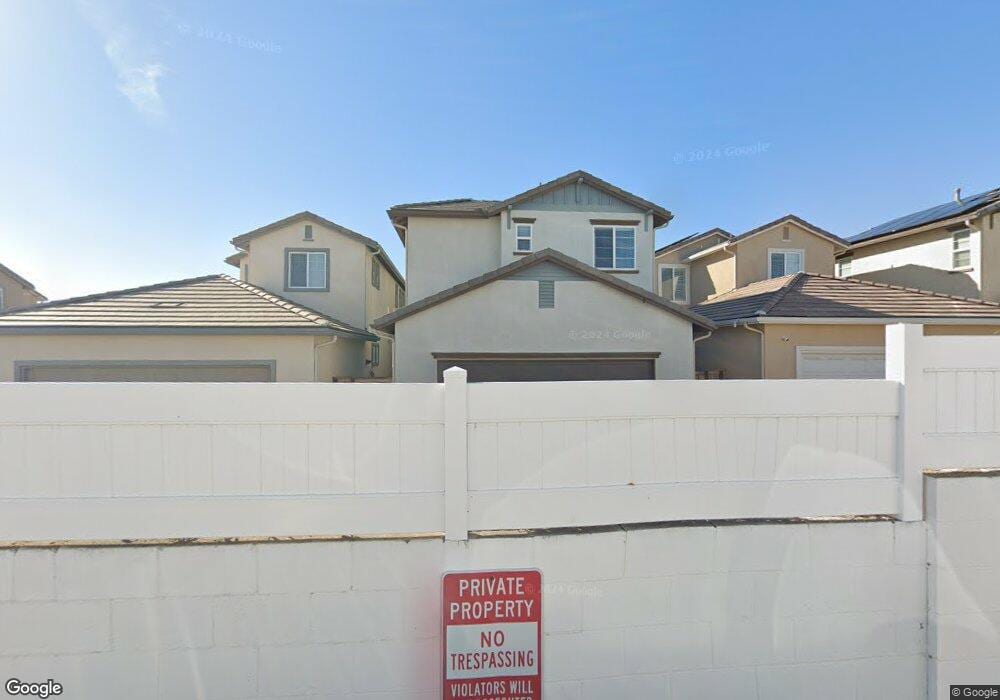
1774 Jasmine Way Oceanside, CA 92054
Loma Alta NeighborhoodEstimated Value: $961,000 - $1,077,000
4
Beds
3
Baths
2,173
Sq Ft
$472/Sq Ft
Est. Value
About This Home
This home is located at 1774 Jasmine Way, Oceanside, CA 92054 and is currently estimated at $1,024,899, approximately $471 per square foot. 1774 Jasmine Way is a home with nearby schools including Mission Elementary School, Oceanside High School, and St. Mary Star Of The Sea Elementary School.
Ownership History
Date
Name
Owned For
Owner Type
Purchase Details
Closed on
Oct 14, 2020
Sold by
Bosworth Stephen C and Weisel Bosworth Wendy
Bought by
Bosworth Stephen C and Weisel Bosworth Wendy
Current Estimated Value
Home Financials for this Owner
Home Financials are based on the most recent Mortgage that was taken out on this home.
Original Mortgage
$456,500
Outstanding Balance
$406,032
Interest Rate
2.9%
Mortgage Type
VA
Estimated Equity
$618,867
Purchase Details
Closed on
Apr 26, 2017
Sold by
Bosworth Stephen C and Weisel Bosworth Wendy A
Bought by
Bosworth Stephen C and Weisel Bosworth Wendy A
Purchase Details
Closed on
Oct 27, 2015
Sold by
Dixie Street Llc
Bought by
Bosworth Stephen C and Weisel Bosworth Wendy A
Home Financials for this Owner
Home Financials are based on the most recent Mortgage that was taken out on this home.
Original Mortgage
$489,704
Interest Rate
3.94%
Mortgage Type
VA
Create a Home Valuation Report for This Property
The Home Valuation Report is an in-depth analysis detailing your home's value as well as a comparison with similar homes in the area
Home Values in the Area
Average Home Value in this Area
Purchase History
| Date | Buyer | Sale Price | Title Company |
|---|---|---|---|
| Bosworth Stephen C | -- | Bnt Title Company Of Ca | |
| Bosworth Stephen C | -- | Bnt Title Company Of Ca | |
| Bosworth Stephen C | -- | None Available | |
| Bosworth Stephen C | -- | None Available | |
| Bosworth Stephen C | $490,000 | First American Title Company |
Source: Public Records
Mortgage History
| Date | Status | Borrower | Loan Amount |
|---|---|---|---|
| Open | Bosworth Stephen C | $456,500 | |
| Previous Owner | Bosworth Stephen C | $489,704 |
Source: Public Records
Tax History Compared to Growth
Tax History
| Year | Tax Paid | Tax Assessment Tax Assessment Total Assessment is a certain percentage of the fair market value that is determined by local assessors to be the total taxable value of land and additions on the property. | Land | Improvement |
|---|---|---|---|---|
| 2025 | $4,508 | $579,702 | $236,756 | $342,946 |
| 2024 | $4,508 | $568,336 | $232,114 | $336,222 |
| 2023 | $6,209 | $557,193 | $227,563 | $329,630 |
| 2022 | $6,115 | $546,268 | $223,101 | $323,167 |
| 2021 | $6,139 | $535,558 | $218,727 | $316,831 |
| 2020 | $5,950 | $530,068 | $216,485 | $313,583 |
| 2019 | $5,777 | $519,676 | $212,241 | $307,435 |
| 2018 | $5,716 | $509,487 | $208,080 | $301,407 |
| 2017 | $5,611 | $499,498 | $204,000 | $295,498 |
| 2016 | $4,115 | $370,110 | $131,110 | $239,000 |
| 2015 | $1,334 | $119,291 | $119,291 | $0 |
| 2014 | $1,284 | $116,955 | $116,955 | $0 |
Source: Public Records
Map
Nearby Homes
- 1786 Jasmine Way
- 1767 Ragtime Way
- 2146 Foster St
- 320 Isthmus Way Unit 31
- 0 Saratoga St
- 326 Grant St
- 265 Loma Alta Dr Unit D8
- 415 Stoney Point Way Unit 106
- 506 Canyon Dr Unit 61
- 506 Canyon Dr Unit 85
- 1417 Lemon St
- 585 Lands End Way Unit 232
- 430 Stoney Point Way Unit 124
- 1223 Division St
- 0 Amick St Unit 1.73 250034248
- 722 &718 N Freeman St
- 515 517 Grant
- 552 Canyon Dr Unit 29
- 520 Grant St
- 301 S Horne St
- 1778 Jasmine Way
- 1770 Jasmine Way
- 1782 Jasmine Way
- 1768 Jasmine Way
- 1728 Jasmine Way
- 1792 Dixie St
- 1784 Dixie St
- 1788 Dixie St
- 1796 Dixie St
- 1775 Jasmine Way
- 1783 Jasmine Way
- 1787 Jasmine Way
- 1780 Dixie St
- 1791 Jasmine Way
- 1776 Dixie St
- 1772 Dixie St
- 0 Dixie St Unit 140045850
- 0 Dixie St Unit 140045849
- 0 Dixie St Unit NDP2209956
- 0 Dixie St Unit 148-272-46-00