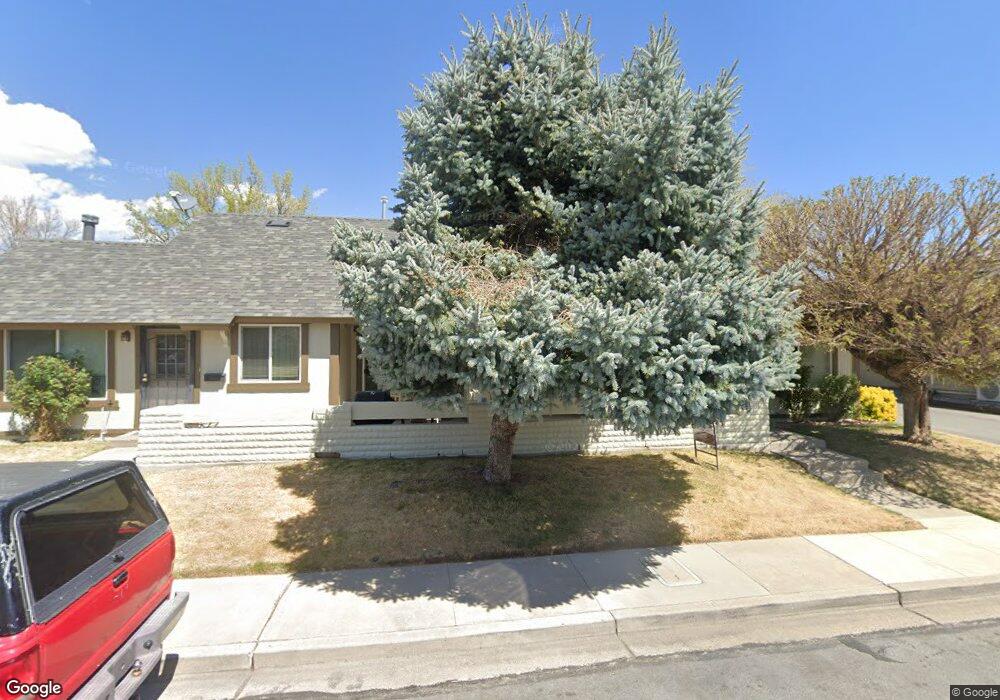
1774 Manchester Way Sparks, NV 89431
North Rock NeighborhoodEstimated Value: $293,000 - $303,000
2
Beds
2
Baths
1,059
Sq Ft
$282/Sq Ft
Est. Value
About This Home
This home is located at 1774 Manchester Way, Sparks, NV 89431 and is currently estimated at $298,626, approximately $281 per square foot. 1774 Manchester Way is a home located in Washoe County with nearby schools including Alice Maxwell Elementary School, Sparks Middle School, and Sparks High School.
Ownership History
Date
Name
Owned For
Owner Type
Purchase Details
Closed on
Feb 25, 2006
Sold by
Austin Dean W
Bought by
Austin Dean Wade and The Dean W Austin Living Trust
Current Estimated Value
Purchase Details
Closed on
Aug 1, 2001
Sold by
Hernandez Reyna A
Bought by
Austin Dean W
Home Financials for this Owner
Home Financials are based on the most recent Mortgage that was taken out on this home.
Original Mortgage
$84,450
Outstanding Balance
$32,800
Interest Rate
7.09%
Estimated Equity
$265,826
Purchase Details
Closed on
Jul 15, 1998
Sold by
Hernandez Reyna A and Shelley Reyna A
Bought by
Hernandez Reyna A
Home Financials for this Owner
Home Financials are based on the most recent Mortgage that was taken out on this home.
Original Mortgage
$72,500
Interest Rate
7%
Purchase Details
Closed on
May 13, 1997
Sold by
Dullum Scott Richard and Dullum Tamara
Bought by
Shelley Reyna A
Home Financials for this Owner
Home Financials are based on the most recent Mortgage that was taken out on this home.
Original Mortgage
$71,550
Interest Rate
8.08%
Create a Home Valuation Report for This Property
The Home Valuation Report is an in-depth analysis detailing your home's value as well as a comparison with similar homes in the area
Home Values in the Area
Average Home Value in this Area
Purchase History
| Date | Buyer | Sale Price | Title Company |
|---|---|---|---|
| Austin Dean Wade | -- | None Available | |
| Austin Dean W | $89,000 | Founders Title Co | |
| Hernandez Reyna A | -- | United Title | |
| Shelley Reyna A | $79,500 | First American Title Co |
Source: Public Records
Mortgage History
| Date | Status | Borrower | Loan Amount |
|---|---|---|---|
| Open | Austin Dean W | $84,450 | |
| Previous Owner | Hernandez Reyna A | $72,500 | |
| Previous Owner | Shelley Reyna A | $71,550 |
Source: Public Records
Tax History Compared to Growth
Tax History
| Year | Tax Paid | Tax Assessment Tax Assessment Total Assessment is a certain percentage of the fair market value that is determined by local assessors to be the total taxable value of land and additions on the property. | Land | Improvement |
|---|---|---|---|---|
| 2025 | $651 | $39,975 | $26,285 | $13,690 |
| 2024 | $651 | $39,639 | $25,865 | $13,774 |
| 2023 | $632 | $36,556 | $24,675 | $11,881 |
| 2022 | $609 | $28,522 | $18,480 | $10,042 |
| 2021 | $597 | $23,486 | $13,090 | $10,396 |
| 2020 | $578 | $23,897 | $13,055 | $10,842 |
| 2019 | $561 | $22,623 | $11,550 | $11,073 |
| 2018 | $545 | $18,803 | $7,630 | $11,173 |
| 2017 | $529 | $18,313 | $6,895 | $11,418 |
| 2016 | $516 | $17,450 | $5,530 | $11,920 |
| 2015 | $515 | $16,774 | $4,340 | $12,434 |
| 2014 | $500 | $15,534 | $3,465 | $12,069 |
| 2013 | -- | $13,279 | $2,380 | $10,899 |
Source: Public Records
Map
Nearby Homes
- 1595 York Way
- 1731 Gault Way Unit D
- 1799 Vance Way
- 2154 Oppio St
- 1620 Gault Way
- 1655 Byrd Dr
- 1345 Plymouth Way
- 0 N Mccarran Blvd Unit 250052909
- 1160 York Way
- 1780 Greenbrae Dr
- 1125 Dodson Way
- 1110 Xman Way
- 1124 Sbragia Way
- 1855 Verano Dr
- 3269 Valley Forge Way
- 1365 Prospect Ave
- 3116 Sterling Ridge Cir
- 1121 Greenbrae Dr
- 1003 Sbragia Way
- 1889 Merchant St
- 1776 Manchester Way
- 1772 Manchester Way
- 1775 York Way
- 1736 Manchester Way
- 1732 Manchester Way
- 1773 York Way
- 1737 York Way
- 1771 York Way
- 1771 London Cir
- 1773 London Cir
- 1734 Manchester Way
- 1730 Manchester Way
- 1781 London Cir
- 1733 York Way
- 1783 London Cir
- 1775 London Cir
- 1763 London Cir
- 1777 London Cir
- 1731 York Way
- 1785 London Cir