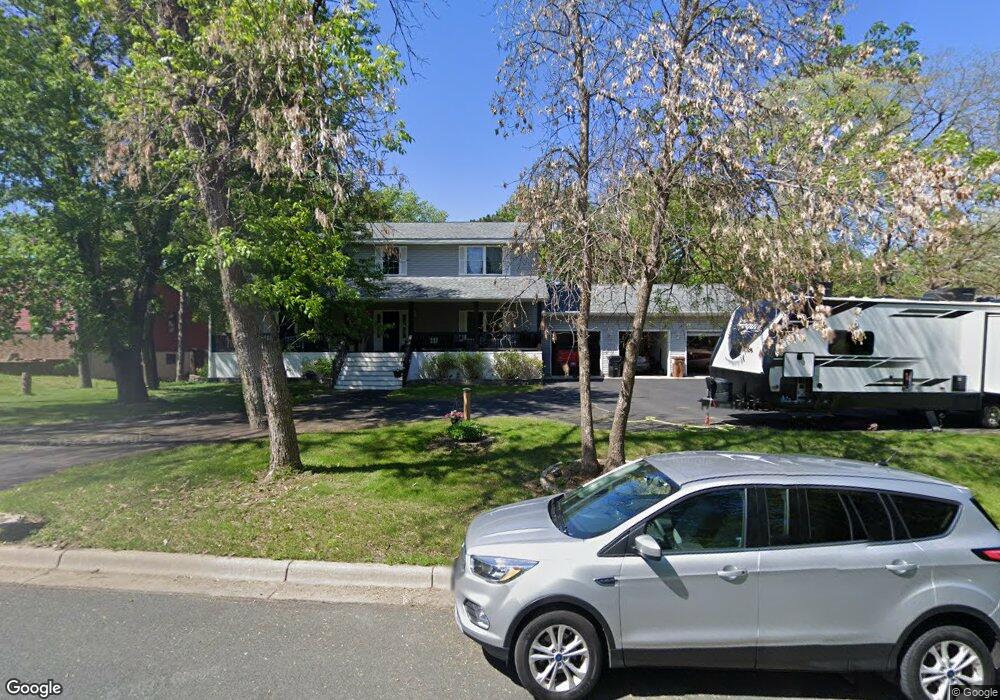
1775 60th St E Inver Grove Heights, MN 55077
Estimated Value: $574,000 - $733,000
4
Beds
4
Baths
4,044
Sq Ft
$157/Sq Ft
Est. Value
About This Home
This home is located at 1775 60th St E, Inver Grove Heights, MN 55077 and is currently estimated at $635,815, approximately $157 per square foot. 1775 60th St E is a home located in Dakota County with nearby schools including Salem Hills Elementary School, Inver Grove Heights Middle School, and Simley Senior High School.
Ownership History
Date
Name
Owned For
Owner Type
Purchase Details
Closed on
Nov 12, 2019
Sold by
Opendoor Property C Llc
Bought by
Nelson Cory A and Nelson Margaret A
Current Estimated Value
Home Financials for this Owner
Home Financials are based on the most recent Mortgage that was taken out on this home.
Original Mortgage
$423,000
Outstanding Balance
$372,501
Interest Rate
3.65%
Mortgage Type
New Conventional
Estimated Equity
$263,314
Purchase Details
Closed on
Sep 27, 2019
Sold by
Dosthadis Mike and Dosthadis Kathy
Bought by
Opendoor Property C Llc
Home Financials for this Owner
Home Financials are based on the most recent Mortgage that was taken out on this home.
Original Mortgage
$423,000
Outstanding Balance
$372,501
Interest Rate
3.65%
Mortgage Type
New Conventional
Estimated Equity
$263,314
Purchase Details
Closed on
Jan 29, 2016
Bought by
Doschadis Mike Mike
Purchase Details
Closed on
Oct 3, 2014
Sold by
Schindeldecker Robert and Schindeldecker Jeannine
Bought by
Christiana Trust
Create a Home Valuation Report for This Property
The Home Valuation Report is an in-depth analysis detailing your home's value as well as a comparison with similar homes in the area
Home Values in the Area
Average Home Value in this Area
Purchase History
| Date | Buyer | Sale Price | Title Company |
|---|---|---|---|
| Nelson Cory A | $470,000 | North American Title Company | |
| Opendoor Property C Llc | $462,000 | Opendoor Title Llc | |
| Doschadis Mike Mike | $303,400 | -- | |
| Doschadis Mike | $303,348 | Title One Inc | |
| Christiana Trust | $408,230 | None Available |
Source: Public Records
Mortgage History
| Date | Status | Borrower | Loan Amount |
|---|---|---|---|
| Open | Nelson Cory A | $423,000 |
Source: Public Records
Tax History Compared to Growth
Tax History
| Year | Tax Paid | Tax Assessment Tax Assessment Total Assessment is a certain percentage of the fair market value that is determined by local assessors to be the total taxable value of land and additions on the property. | Land | Improvement |
|---|---|---|---|---|
| 2024 | $6,256 | $578,800 | $87,000 | $491,800 |
| 2023 | $6,256 | $583,900 | $82,300 | $501,600 |
| 2022 | $5,264 | $554,100 | $82,200 | $471,900 |
| 2021 | $5,118 | $469,700 | $71,500 | $398,200 |
| 2020 | $4,700 | $448,600 | $68,100 | $380,500 |
| 2019 | $5,393 | $410,300 | $64,800 | $345,500 |
| 2018 | $4,915 | $362,300 | $61,800 | $300,500 |
| 2017 | $5,122 | $321,900 | $58,800 | $263,100 |
| 2016 | $4,851 | $329,000 | $56,000 | $273,000 |
| 2015 | $5,242 | $315,600 | $54,700 | $260,900 |
| 2014 | -- | $316,000 | $52,600 | $263,400 |
| 2013 | -- | $298,600 | $49,100 | $249,500 |
Source: Public Records
Map
Nearby Homes
- 6090 Babcock Trail
- 5875 Asher Ave
- 1855 63rd St E
- 6320 Baker Ave
- 6495 Beckman Ave
- 2116 65th St E
- 6680 S Robert Trail
- 6494 Bonner Ct
- 6421 Bowman Cir
- 5870 Blackberry Bridge Path
- 6244 Bolland Trail
- 6816 Benton Cir Unit 35
- 6426 Agate Trail
- 5903 Bryant Ln
- 5938 Burke Trail
- 4825 Babcock Trail Unit 2005
- Virginia Plan at Eagles Landing
- Vermont Plan at Eagles Landing
- Tennessee Plan at Eagles Landing
- Sycamore Plan at Eagles Landing
- 1755 60th St E
- 5989 Babcock Trail
- 1735 60th St E
- 1800 60th St E
- 1805 60th St E
- 1810 60th St E
- 1730 60th St E
- 5979 Babcock Trail
- 1715 60th St E
- 6091 Babcock Trail
- 1710 60th St E
- 1820 60th St E
- 5969 Babcock Trail
- 6014 Babcock Trail
- 6095 Babcock Trail
- 5952 Asher Ave
- 5937 Babcock Trail
- 6110 Babcock Trail
- 5938 Asher Ave
- 1861 60th St E