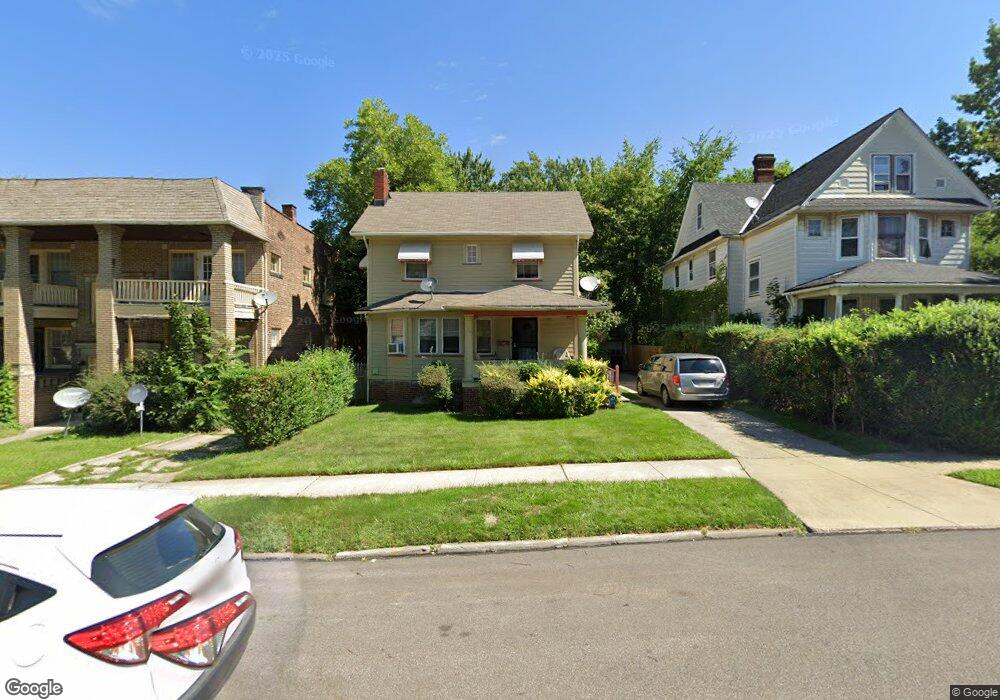
1775 Burgess Rd Cleveland, OH 44112
Euclid-Green NeighborhoodEstimated Value: $69,000 - $92,000
4
Beds
1
Bath
1,336
Sq Ft
$58/Sq Ft
Est. Value
About This Home
This home is located at 1775 Burgess Rd, Cleveland, OH 44112 and is currently estimated at $77,937, approximately $58 per square foot. 1775 Burgess Rd is a home located in Cuyahoga County with nearby schools including Bolton, Anton Grdina School, and Andrew J. Rickoff School.
Ownership History
Date
Name
Owned For
Owner Type
Purchase Details
Closed on
Jun 7, 2011
Sold by
Shabazz Khadjah
Bought by
Shabbazz Khadijah and Shabazz Dawan
Current Estimated Value
Purchase Details
Closed on
Sep 26, 2006
Sold by
Estate Of Muhammad Abdul Shabazz
Bought by
Shabazz Khadijah
Purchase Details
Closed on
Dec 17, 1992
Bought by
Shabazz Muhammad A
Purchase Details
Closed on
Oct 27, 1992
Bought by
Rysar Properties Inc
Purchase Details
Closed on
Jun 18, 1992
Sold by
Vanduzen Helen
Bought by
First Nationwide Bank ,
Purchase Details
Closed on
Jun 29, 1984
Sold by
Wilcox Adele
Bought by
Vanduzen Helen
Purchase Details
Closed on
Dec 10, 1980
Sold by
Richards Shirley L
Bought by
Wilcox Adele
Purchase Details
Closed on
Oct 12, 1979
Sold by
Adele Trail
Bought by
Richards Shirley L
Purchase Details
Closed on
Nov 2, 1978
Sold by
Jelson Anne M
Bought by
Adele Trail
Purchase Details
Closed on
Jan 1, 1975
Bought by
Jelson Anne M
Create a Home Valuation Report for This Property
The Home Valuation Report is an in-depth analysis detailing your home's value as well as a comparison with similar homes in the area
Home Values in the Area
Average Home Value in this Area
Purchase History
| Date | Buyer | Sale Price | Title Company |
|---|---|---|---|
| Shabbazz Khadijah | -- | None Available | |
| Shabazz Khadijah | -- | None Available | |
| Shabazz Muhammad A | $55,900 | -- | |
| Rysar Properties Inc | $16,500 | -- | |
| First Nationwide Bank , | -- | -- | |
| Vanduzen Helen | $18,000 | -- | |
| Wilcox Adele | -- | -- | |
| Richards Shirley L | $7,800 | -- | |
| Adele Trail | -- | -- | |
| Jelson Anne M | -- | -- |
Source: Public Records
Tax History Compared to Growth
Tax History
| Year | Tax Paid | Tax Assessment Tax Assessment Total Assessment is a certain percentage of the fair market value that is determined by local assessors to be the total taxable value of land and additions on the property. | Land | Improvement |
|---|---|---|---|---|
| 2024 | $1,426 | $21,315 | $5,180 | $16,135 |
| 2023 | $1,078 | $13,900 | $2,070 | $11,830 |
| 2022 | $1,072 | $13,900 | $2,070 | $11,830 |
| 2021 | $1,061 | $13,900 | $2,070 | $11,830 |
| 2020 | $1,024 | $11,590 | $1,720 | $9,870 |
| 2019 | $948 | $33,100 | $4,900 | $28,200 |
| 2018 | $821 | $11,590 | $1,720 | $9,870 |
| 2017 | $702 | $8,300 | $880 | $7,420 |
| 2016 | $696 | $8,300 | $880 | $7,420 |
| 2015 | $719 | $8,300 | $880 | $7,420 |
| 2014 | $719 | $8,540 | $910 | $7,630 |
Source: Public Records
Map
Nearby Homes
- 1738 Cliffview Rd
- 1738 Burgess Rd
- 18001 Olympia Rd
- 1682 Cliffview Rd
- 1677 Hillview Rd
- 1646 Avalon Rd
- 1651 Avalon Rd
- 1897 Torbenson Dr
- 1639 Avalon Rd
- 1777 Catalpa Rd
- 1707 Catalpa Rd
- 1617 Catalpa Rd
- 940 London Rd
- 1767 Algonac Rd Unit 2
- 1758 Algonac Rd
- 949 Rudyard Rd
- 19151 Genesee Rd
- 16519 Burnside Ave
- 1547 E 173rd St
- 18132 Weston Rd
- 1769 Burgess Rd Unit 4
- 1769 Burgess Rd Unit 3
- 1769 Burgess Rd Unit 2
- 1769 Burgess Rd Unit 1
- 1769 Burgess Rd
- 1779 Burgess Rd
- 1763 Burgess Rd
- 1783 Burgess Rd
- 1757 Burgess Rd
- 1770 Cliffview Rd
- 1766 Cliffview Rd
- 1776 Cliffview Rd
- 1760 Cliffview Rd
- 1753 Burgess Rd
- 1770 Burgess Rd
- 18007 Euclid Ave
- 1776 Burgess Rd
- 1766 Burgess Rd
- 1756 Cliffview Rd
- 1764 Burgess Rd